Solvay Brussels School Logo

Thesis

Specialized Master in Industrial and Technological Management

Marketing & Entrepreneurship Specialization

Beyond brand equity: how luxury collectibles perform independently of their manufacturer stocks and traditional investment alternatives (2015–2025)

Empirical analysis of investment performance, market independence, and diversification potential across nine collectible asset categories

Abstract

This paper offers an extensive quantitative analysis of luxury collectibles as alternative investments, comparing their performance with traditional equity benchmarks and their manufacturers for the decade from 2015 to 2025. With systematic data gathering across nine different collectible categories—champagne, whisky, watches, handbags, diamonds, classic cars, sneakers, art, and gold—this study compares returns, risks, and diversification potential in relation to four fundamental benchmarks: the MSCI World Index, S&P Global Luxury Index Total Return, Gold Futures (COMEX), and Bitcoin.

The paper subjects four primary hypotheses to both Pearson correlation analysis and two linear regression approach. Findings show remarkable independence between collectibles and their manufacturer stocks, with no significant statistical relationships within over thirty collectible-manufacturer pairs considered. This pervasive decoupling contradicts presumptions of brand equity spillover effects and confirms collectibles as truly unique asset classes functioning independently of corporate financial performance.

Performance analysis illustrates outstanding heterogeneity within collectible categories, from outstanding success stories to severe underperformers. Whisky was the leading absolute performer with the Brora Index realizing 494.82% total returns (19.52% CAGR), while champagne illustrated better risk-adjusted performance with a Sharpe ratio of 1.929 and very low volatility of 5.04%. Luxury handbags illustrated remarkable efficiency, with Hermès Kelly recording a Sharpe ratio of 2.006 and the Constance model showing only 3.69% volatility, corresponding to some of the most appealing risk-return profiles of all asset classes considered.

Nonetheless, the study finds high performance dispersion among collectibles from very stable investments to highly speculative assets. Linear regression detects selective correlations with digital assets and more so Bitcoin, indicating nascent links between some collectibles and cryptocurrency market cycles. Countercyclical relations are found between art and gold futures (p = 0.011) and champagne and luxury stock indices (p = 0.046), indicating hedging properties within luxury portfolios.

Correlation analysis validates that collectibles function with statistical independence from conventional financial markets, with correlation coefficients never exceeding the "no correlation" range of ±0.20 against all major benchmarks tested. These results place judiciously chosen collectibles as efficient portfolio diversifiers with exposure to alternative value determinants such as cultural importance, rarity dynamics, and collector demand instead of conventional financial market pressures.

Chapter 1: Introduction

During the past several decades, the classic dichotomies separating consumption and investment have become ever more ambiguous, especially in luxury markets. Goods that traditionally have been appreciated for their aesthetics, craftsmanship, and ability to convey social status are being openly reassessed as possible alternative investment vehicles. This trend reflects a larger evolution in strategies employed by contemporary investors in managing portfolio diversification. Amid an environment that has witnessed increasing correlations among traditional asset classes during financial market turmoil, coupled with protracted low-yield environments induced by central bank intervention, investors are compelled to turn to alternative asset classes in pursuit of uncorrelated returns and portfolio resilience.

Traditionally, luxury brands have incorporated the notion of value preservation in their marketing rhetoric. By emphasizing attributes such as durability, scarcity, and exceptional craftsmanship, these brands communicate that their products not only deliver aesthetic and emotional gratification but also maintain and potentially enhance monetary value over time. Nevertheless, while these claims are plausible from a consumer perspective, their validity as investment propositions requires systematic empirical testing. This divergence between marketing promise and investment reality forms one of the central tensions examined in this research.

This study focuses on a central economic paradox: the possibility of a "financial aging premium" in luxury collectibles that defies traditional consumer economic theory. While conventional commodities follow standard depreciation curves where value diminishes upon acquisition and continues to depreciate with use and age, certain luxury collectibles exhibit reverse dynamics where aging creates rather than destroys value through mechanisms such as scarcity creation, quality improvement over time, and cultural value accumulation. Therefore, it becomes essential to investigate exactly how much luxury goods do, in fact, act like genuine financial instruments and possess quantifiable aging premiums, specifically compared to the publicly traded equities of their producers.

The present study embarks on an exhaustive decade-long investigation of the financial performance of luxury collectibles amid the intersection of several related market trends. First, the professionalization of collectibles markets, as reflected in the launch of professional price indices, specialized investment platforms, and increasing involvement of institutional investors, has enhanced transparency and legitimacy of such markets. Second, increasing sophistication among high-net-worth individuals and family offices and demand for differentiated sources of returns have stoked interest in alternative assets utilized to diversify traditional portfolios. Additionally, enhanced access to data facilitated through auction records, specialized indices, and proprietary market research now allows for more extensive quantitative analysis of luxury asset performance.

Furthermore, a broader classification of "emotional assets" or "passion investments," such as designer handbags, vintage cars, high-end diamonds, and rare sneakers, has experienced significant market growth. These trends necessitate a thorough reconsideration of what role these assets can have in investment portfolios today.

1.1 Context

The research interest aims to conduct an exhaustive comparative examination of the performance of individual luxury collectibles and the stock performance of their respective luxury brands over a ten-year period from 2015 to 2025. More specifically, the goal is to compare the performance of individual collectibles and luxury brand stocks in nine different categories and determine their efficacy as alternative investments based on representative case studies and systematic quantitative analysis.

Market record in recent years attests to the huge financial value of luxury collectibles spanning various categories. Leonardo da Vinci's Salvator Mundi became the highest-priced painting ever auctioned in 2017 at $450.3 million at Christie's in New York, while Pablo Picasso's Les Femmes d'Alger (Version 'O') previously traded for $179.4 million, reflecting the masterly role played by masterpieces within the world of art investment.

For the high-end watch industry, record-breaking sales continue to establish new benchmarks, with Patek Philippe registering a $31 million sale for its Grandmaster Chime timepiece in 2019, thus reflecting the consistent growth and development of the high-end watch investment marketplace.

Wine analysis demonstrates the same exceptional performance, with a 1945 Romanée-Conti fetching $558,000 at a Sotheby's sale in 2018, reflecting the robust demand for premium vintage wines from collectors and investors looking for alternative asset exposure.

Whisky is a significant investment category in the collectibles world, and The Macallan whisky has positioned itself as a highly sought-after investment piece. One bottle from the 1926 Fine & Rare Collection sold for a whopping $1.9 million at Sotheby's in 2019, and other versions of The Macallan 1926, such as the Peter Blake and Michael Dillon editions, sold for $1.1 million each, attesting to the high-end quality of rare spirits as an investment class.

No longer just viewed as fashionable accessories, luxury handbags have become serious investment tools. The iconic Birkin bag, prized for its exclusivity and flawless craftsmanship, consistently sells at auction for more than its initial retail price. The ultimate endorsement of this investment value came in July 2025, when Jane Birkin's personal Hermès Birkin bag—the original prototype designed especially for the legendary actress in 1985—sold at Sotheby's Paris for a record €8.6 million ($10.1 million), the most expensive handbag ever sold at auction.

1.2 Theoretical Framework and Research Design

This thesis examines the investment behavior of collectibles compared to traditional investment markets using a strict theoretical context based on modern portfolio theory and alternative asset pricing theory. Based on existing literature on asset diversification, brand equity theory, and the alternative investment market, the research formulates and tests empirically four exact hypotheses using excess logarithmic returns and extensive linear regression analysis.

This research explores luxury collectibles as alternative investments by undertaking an in-depth study of nine different categories, each specifically chosen to reflect mature parts of the collectibles market with adequate data availability and market transparency.

The study includes champagne (symbolized by the Liv-ex Champagne 50 Index, including Dom Pérignon and other LVMH luxury brands), rare whisky (monitored by the RWB-Rare Whisky Brora Index), luxury watches (examined via several WatchCharts indices covering both publicly-traded conglomerates and independent producers), luxury handbags (highlighting three Hermès models: Birkin, Kelly, and Constance through LuxPriceIndex data), diamonds (gauged using the IDEX Diamond Index), classic cars (with Ferrari models spanning three time periods covered in K500 indices, Porsche classics also featured in K500 indices and in the Pricing Culture Porsche Index CLTBPORSH. Aston Martin cars are symbolized by the Pricing Culture Aston Martin Index CLTBASTMA), sneakers (symbolized by the CRWDSNKR Index highlighting culturally relevant Nike models), art (monitored by the Art Market Research Index), and gold (via COMEX Gold Futures as both a collectible and benchmark asset).

Each collectible type is matched with corresponding publicly-traded luxury goods companies to investigate possible connections between tangible assets and their producers' equity performance. They are LVMH (Euronext Paris) for champagne and luxury watches, Diageo (LSE) for rare whisky, Hermès (Euronext Paris) for luxury handbags and watches, Richemont for watches and diamonds, Swatch Group for timepieces, Ferrari (NYSE: RACE) for classic cars, Porsche Holding SE (PAH3.DE) for vintage Porsche cars, Aston Martin Lagonda (LSE: AML.L) for British classic cars, Nike (NYSE: NKE) for collectible sneakers, and Signet Jewelers Limited for diamond retail exposure.

As preliminary correlation testing and linear regression testing between collectibles and their issuer stocks was generally inconclusive—with correlation coefficients consistently falling within the "no correlation" range and regression relationships failing to display statistical significance—the study widened to consider more general market relationships. There are four foundation benchmarks used as independent variables in the analysis: the MSCI World Index (for global equity market performance), the S&P Global Luxury Index Total Return (to capture luxury segment dynamics), COMEX Gold Futures (GCF, for traditional safe-haven assets), and Bitcoin (for digital alternative assets and speculative investment attitudes).

The 13-Week U.S. Treasury Bill is used as the risk-free rate proxy to compute excess returns and Sharpe ratios for all asset classes. This framework allows us to investigate if collectibles are market-neutral alternatives or have systematic relationships with conventional financial markets, commodity prices, or new digital assets.

Notable Examples of Record Sales

Art Market
Art Market Items
Leonardo da Vinci's Salvator Mundi
$450.3M Christie's, 2017
Luxury Watches
Luxury Watches
Patek Philippe Grandmaster Chime
$31M Christie's, 2019
Wine
Wine
1945 Romanée-Conti
$558K Sotheby's, 2018
Whisky
Whisky
Macallan 1926 Fine & Rare
$1.9M Sotheby's, 2019
Luxury Handbags
Luxury Handbags
Himalaya Birkin bag
$388.7K Christie's HK, 2017
Classic Cars
Classic Cars
1963 Ferrari 250 GTO
$70M Private sale, 2018
Diamonds
Diamonds
Pink Star Diamond
$71.2M Sotheby's, 2017
Sneakers
Sneakers
Nike Air Yeezy 1 Prototype
$1.8M Sotheby's, 2021

Comparison: Collectibles vs Luxury Brands

This comparison shows the relationship between specific luxury collectibles and their corresponding brand manufacturers.

Collectibles Luxury Brands
Champagne & Tag Heuer
LVMH
Birkin / Kelly / Constance handbags
Hermès
Cartier / IWC / Jaeger-LeCoultre / Vacheron Constantin
Richemont
Brora index (Whisky)
Diageo
Omega watch & Breguet Watch
Swatch group
Diamonds
Tiffany & Co / LVMH / Richemont / Signet
Ferrari classic cars
Ferrari
Aston Martin classic cars
Aston Martin
Porsche classic cars
Porsche
Nike Sneakers
Nike

1.3 Analytical Framework and Methodological Innovation

To create a robust and comparative basis for assessing the investment performance of luxury collectibles, this analysis utilizes an advanced analytical framework based on four fundamental indices that act as central benchmarks throughout the study. The MSCI World Index provides broad equity market performance across developed and emerging markets, offering a broad baseline for global stock market performance. The S&P Global Luxury Index Total Return follows publicly traded companies in the luxury space, providing specific insight into the performance of luxury-oriented equity investments compared to collectible alternatives. Gold Futures from the COMEX exchange are a traditional store of value and safe-haven asset, allowing for the examination of collectibles' performance compared to traditional hedging tools. Bitcoin is also included as a representative digital asset, recognizing the increasing prominence of cryptocurrency markets and their potential overlap with alternative investment strategies.

These four benchmarks form the basis for measuring and comparing risk-adjusted returns, volatility patterns, correlation structures, and portfolio diversification potential for all collectible categories considered. The choice of these particular indices is based on both theoretical grounds regarding market coverage and practical grounds relating to data availability, quality, and comparability over the long time period being investigated.

The study integrates an advanced conceptualization of collectible market development in the form of a four-stage model of collectible status development. This theoretical advancement acknowledges that the development from functional product to investment-grade collectible is achieved in stages: Launch, Latency, Popularity Boom, and Maturity. In the Launch phase, the product enters the market largely as a functional or status good with little consideration of eventual collectible status. The Latency phase is a formative period of cultural meaning development, nascent secondary market formation, and collector community building around particular products or brands.

The Popularity Boom phase is where the recognition of collectibles gathers speed, with heightening auction activity, media coverage, enhanced public awareness of investment, and the emergence of more refined pricing systems. The final Maturity phase is where complete assimilation of collectible status into brand identity and market dynamics occurs, with secondary markets well established, professional trading exchanges, orderly price discovery, and acknowledgment by institutional investors and wealth managers. This evolution model gives vital context to the question of why some products become collectibles and others are purely functional, and also how timing influences both collector behavior and investment returns.

The analytical model raises basic questions regarding market efficiency, price discovery mechanisms, and the interaction between cultural value and financial return in luxury markets. By subjecting traditionally qualitatively or subjectively assessed assets to stringent quantitative analysis, the research makes important methodological contributions to alternative investment scholarship while offering actionable implications for portfolio design and risk management strategies.

1.4 Data Collection and Index Construction

The research examines eight separate collectible categories via carefully chosen specialist indices that reflect the most transparent and liquid portions of each market. To analyze champagne, the study uses the Liv-ex Champagne 50 Index, which is made up of the 50 most recent physical vintages of around 15 top prestige champagne houses, with major representation from LVMH-owned brands like Dom Pérignon, Krug, and Veuve Clicquot. The index offers quarterly rebalancing and is based on real-time trading on the London International Vintners Exchange, providing transparency and liquidity data necessary for stringent financial analysis.

Rare whisky research here is centered on the RWB-Brora Index Values drawn from Rare Whisky 101, with a specific focus on bottles from the closed Brora distillery. Consistency and stability are favored here over wider market coverage with the view that the fixed basket of historically relevant bottles from this classic closed distillery offers more dependable measure of longer-term value retention and price performance than wider, regularly rebalanced indices that can be prone to shorter-term pricing fluctuation.

Luxury watch research leverages WatchCharts brand-specific indices, which offer daily-updated, transaction-based pricing information across both publicly-listed luxury conglomerates and independent high-end producers. The approach includes both corporate-affiliated brands such as LVMH, Richemont, Swatch Group, and Hermès watch units, and independent maisons like Rolex, Patek Philippe, Audemars Piguet, and A. Lange & Söhne. This inclusive method allows for analysis of how ownership structure influences collectible performance while ensuring methodological consistency across market segments.

For the luxury handbags, the study uses LuxPriceIndex data for three specific Hermès models: the Birkin, Kelly, and Constance. The model-specific indices are based on about 400,000 auction records spanning 15 years, forming solid statistical underpinnings for the analysis of performance. The emphasis on Hermès is both the brand's extensively documented secondary market performance and its status as industry leader in resale value retention, making it a best-case scenario for examining the designer handbag as an investment.

Diamond analysis is based solely on the IDEX Diamond Index, which is kept by IDEX Online in collaboration with Tel Aviv University. The index represents the most consistent, regularly updated, and methodologically transparent benchmark for polished natural diamonds, with updates every hour and complemented by integration with information from the Israel Diamond Institute to provide complete real-time market intelligence.

Classic car research integrates the K500 Index and its Ferrari-specific sub-indices, divided by era of production to reflect collector-driven value stratification, and K500 for Porsche and Pricing Culture indices for Porsche and Aston Martin. The segmentation strategy acknowledges that classic car markets are highly heterogeneous on the basis of historical era, rarity, and cultural profile, demanding sophisticated analysis that controls for these salient differences.

Sneaker analysis is by way of the CRWDSNKR Index maintained by Pricing Culture, with high-value and culturally prominent models from Nike being the main emphasis, supplemented selectively with other brands such as the Yeezy 350 line for Adidas cultural prominence in certain timeframes. Art market analysis, lastly, uses the Art Market Research Index, with the Core ArtistsX dataset that consists of artists who have had their work sold in excess of thirty times in rolling 24-month periods being used, to provide adequate liquidity as well as frequency of transactions for meaningful statistical analysis.

The data gathering approach prioritizes transparency, liquidity, and representativeness in every category while recognizing the intrinsic difficulty in examining alternative assets with differing levels of market maturity and standardization. Every index choice represents thoughtful deliberation regarding data quality, methodological consistency, and applicability to modern collectibles investing to guarantee that the analysis is capturing true market action as opposed to statistical artifacts or niche market segments.

1.5 Methodological Innovation and Dual Regression Framework

The methodology employs a sophisticated dual regression method that is a significant methodological advancement to alternative investment scholarship. The first set of regressions examines correlations between collectibles and their corresponding luxury brand manufacturer stocks using manufacturer stock price as an independent variable and collectible indices as a dependent variable. The method tests specifically if collectibles correlate with their corresponding brand's financial market performance and can serve as proxies, hedges, complements, or indicators of brand strength.

This definition allows for important boundaries, including the possibility of reverse or bidirectional causality where collectible values can support parent brand prestige and influence market opinion. Methodology does have regard, however, to the fact that most large-cap luxury companies are subject to more macroeconomic drivers, diversified product portfolios, and institutional investor flows, so the direct effect of collectibles on near-term financial performance is really trivial while still allowing longer-term brand value effects.

The second regressions test connections to broader financial market measures, with the four major benchmarks as the independent variables in all collectible classes. Overall analysis is for correlation with global equity performance, luxury sector fashion, commodity price fluctuations, or speculative digital asset volatility. The methodology enables the identification of system risk factors, market sensitivity patterns, and hedging opportunities in different collectible classes.

All calculations employ excess logarithmic returns in order to offer statistical sophistication and comparability across asset classes with different scaling, volatility, and return distribution characteristics. The use of logarithmic returns provides improved aggregation properties over periods of time and permits the use of models assuming normally distributed returns. Statistical significance is calculated in terms of p-values at 5% level, while additional inferences are derived using beta coefficients, R-squared, and total correlation analysis using Pearson correlation coefficients derived using Microsoft Excel analytical functions.

Two-regression methodology provides for the identification of selective pattern correlations that are not evident through simple correlation analysis, like precise patterns among collectibles and other market variables. The methodology provides primary evidence to justify portfolio construction decisions and risk management procedures with luxury collectibles as alternative investments in conjunction with responses to critical questions of whether collectibles are market-neutral alternatives or possess systematic relations to traditional and alternative financial assets.

The new methodology treats collectibles as sophisticated financial instruments worthy of rigorous quantitative analysis while respecting their unique character as cultural artifacts and status symbols. This synergy of methodology guarantees that the research discovers both the economic and cultural sides of the value creation in collectibles and situates findings in debates around alternative asset allocation and modern portfolio theory.

1.6 Research significance and contemporary relevance

This research answers both empirical investigation into the value-creation mechanism in luxury markets and practical concerns around modern portfolio construction during an era of increasing market complexity and correlation among traditional assets. Through the use of stringent financial performance measures such as Sharpe ratios, beta coefficients, and correlation analysis to assets traditionally measured using qualitative or anecdotal techniques, the research makes important methodological contributions towards alternative investment literature.

The research applied relevance extends to various stakeholder groups in the contemporary investment climate. For private collectors intending to sharpen buying strategies, the research provides empirical evidence underpinning investment choices previously based on experience, cultural familiarity, or incompletely accessible market information. High-net-worth individuals seeking alternative assets allocation find use in systemic performance metrics and risk-adjusted returns analysis for informing strategic portfolio selection. Institutional asset managers considering adding collectibles to diversified portfolios obtain organized analytical instruments for evaluating such offbeat asset classes alongside traditional investments.

This research contributes to broader understanding of how cultural capital is converted into financial returns, at which points aesthetic value and investment return meet, and how alternative asset classes are formed in portfolio theory. These insights take on greater urgency as institutional investment in alternative investments accelerates and new investors seek portfolio diversification approaches that extend beyond classical financial assets to those which yield financial returns as well as personal satisfaction.

The research methodology pursued establishes a replicable framework for ongoing study of this dynamic realm, whereas the empirical findings offer actionable insights for investors interested in incorporating alternative assets into their portfolios. The potential to transpose cultural artifacts into investment vehicles is an indication of a broader transformation of value creation, preservation, and transmission across generations, rendering collectibles sophisticated portfolio devices and not mere naked alternatives detached from overall market forces.

The timeliness of this research in today's world is compounded by several overlapping trends: technology-driven democratization of alternative investment, the increasing maturity of collectibles markets through professional indices and authentication systems, and institutional investor acknowledgment that alternative assets can provide diversification benefits as much as access to cultural and demographic movements not necessarily reflected in traditional finance instruments. As markets mature and new asset classes for collecting are produced, the analytical model developed in this study provides a framework for future research and practical application within the growing universe of alternative investments.

Chapter 2: Literature Review

2.1 Luxury goods: a marketing promise of value retention

For the luxury market, luxury brands use the value retention marketing promise as one of the key strategies for acquiring and keeping customers. This is based on the assumption that these luxury products will not just enhance one's status but gain in value or even increase their value over time. This is a marketing strategy seen in many different industries such as watches, wine, rum, cars, bags, and even real estate and art, as compared to the general trend of consumables that lose value over time and use.

Watches make a great example of this marketing assurance. Wristwatch companies like Rolex and Patek Philippe sell watches as something more than a symbol of status, it is also an investment to be contemplated over the long run. Watch models made by Patek Philippe, for example, are showcased as limited editions with the hope of substantial value appreciation. Auction results often validate the above assertion, as certain Patek Philippe models are auctioned for multiple times their original value (Phillips, 2021a; Phillips, 2021b). Similarly, Rolex's vintage models like the Daytona have reflected handsome resale value as well, testifying to the success of this marketing strategy (Hodinkee, 2024).

In the fine wine market, the guarantee of maintaining value is equally persuasive. Luxury wines, particularly those that are produced in top regions like Bordeaux and Burgundy, are not just being purchased for their higher taste but also for their worth as a form of investment. It has been discovered through research that some years' worth of wine production have been profitable, which supports the claim of wine as a good investment. Liv-ex and others provide ways of monitoring the performance of quality wines as investments, noting their ability to retain value in the long term (Liv-ex, 2024).

The handbag industry also takes advantage of the passion for holding value. Luxurious brands such as Hermès and Chanel take advantage of this to increase the desire for their products. The Hermès Birkin handbag can be observed being not only advertised as a style accessory but even as an investment. According to reports, Birkin bags have increased in value more than traditional investments such as stocks and gold (Public, 2024; Rebag, 2023).

Appreciation in value is highly promoted in the fine art market. Frequently, works of art by the masters like Banksy are promoted with the promise of a much greater value appreciation. The outcome of auctions frequently is reflective of this bias as items frequently sell at record high prices that make them more appealing as investments (Sotheby's, 2024). This type of marketing points to an even broader phenomenon where art carries cultural as well as financial significance.

The vintage car market also employs the value preservation promise as a way to entice collectors and connoisseurs. Ageless Ferrari and Porsche models are marketed on the belief that their value will increase over time. Ferrari 250 GTO has created interest with immense value potential to increase as evident by enormous price increases in auction sales (Gooding, 2024).

While highlighting the merits of value appreciation succeeds in marketing, there is a need to understand its intricacies. Fluctuations and fashions in the luxury industry can influence the value of high-end products. Not everything is bound to appreciate as predicted, and therefore, the prospective consumers ought to have a well-informed outlook when they make such investments (Sherwood, 2024; Zimnisky, 2024). The necessity for scrutiny and comprehension is evidenced by the inherent risks and market forces.

2.2 Concepts used & terms definitions

2.2.1 CAPM

The study uses various basic ideas and approaches from finance, economics, and investment theory to examine alternative investments and traditional assets. At the core of this research is the Modern Portfolio Theory (MPT), which emphasizes the significance of diversification and managing risk in relation to reward. The study uses Modern Portfolio Theory to assess all assets in our study. The aim is to analyze the risk-adjusted returns of these assets to understand their contribution to forming an optimal investment portfolio.

Analyzing investment metrics is crucial in this evaluation. The research computes the mean returns and standard deviation (volatility) for every asset category. Furthermore, the Sharpe ratio is used to evaluate risk-adjusted returns and will be calculated for comparison of the assets' performance. Correlation analysis will be carried out to examine the interactions between these assets. This evaluation will assist in deciding if these assets provide diversification advantages by studying their movements in relation to each other.

Empirical methods will be used for comparing profitability. Time-series analysis will be utilized to assess past performance data from 2015 to 2025, with the objective of detecting patterns, fluctuations, and irregularities in asset performance. Regression analysis involves using econometric models to examine the connections between the performance of luxury company stocks and other investment options.

Collecting data is an essential part of the methodology. The study will collect past prices and performance information for equity indices and individual luxury company stocks. In the case of alternative assets, data sources will encompass auction outcomes, market indexes, and transaction logs linked to wines, watches, whisky, luxury bags, and art. The goal of the study is to conduct a comprehensive analysis of different asset classes and their advantages in a diversified investment portfolio by combining these methods and sources of data (Hillier,2024, OpenAI,2025).

2.3 Alternative Investments

(Chambers, 2020) attempt to establish a definition for alternative investments by contrasting them with conventional investments. They are described in two manners: one in terms of what they are not, and the other in relation to what they do not encompass. For some, alternative investments can be any form of investment that does not necessarily involve holding conventional investments for long periods. Traditional investments consist of stocks, bonds, and cash that are traded on the stock market. Any form of investment can be considered as postponing consumption. An investment could be any outlay of cash in anticipation of future advantage. Investments could be anything from planting a tree to purchasing stocks to obtaining a college education.

Another way of classifying alternative investments is to put them into four broad categories: real assets, hedge funds, private equity, and structured products. Real assets include natural resources, real estate, and infrastructure. Hedge funds include strategies such as managed futures. Private equity includes venture capital and buyouts, and structured products include instruments such as credit derivatives (Chambers, 2020).

The selected physical assets—wine, whisky, watches, art, gold, champagne, handbags, diamonds, classic cars, and sneakers—would typically fall under the category of real assets, more specifically as collectibles in the alternative investment space. On the other hand, the stock indices and luxury brand equities in this study are traditional investments.

The authors determine several distinguishing features of alternative investments; their ability to diversify due to their absence of or inverse correlation with traditional investments, enabling portfolio diversification and risk reduction. Alternative investments are comparatively less liquid than stock markets with thin trading volumes, and it is hard to determine real-time intrinsic value. Sale may take a long time and be costly, typically necessitating the need for a risk premium or discount.

2.3.1 Collectibles

2.3.1.1 Champagne

Defining the wine market is difficult due to its complex and multifaceted nature, as stated by (Cardebat, 2017). While stocks are simply investments in companies, wine serves multiple functions at the same time. (Cardebat, 2017) in "Économie du vin" states that the wine market can be categorized as an agricultural commodity, luxury good, crafted product, cultural artifact, industrial product, or alternative financial asset. The market's diversity prevents it from being simplified into one characteristic or definition.

The global wine market is estimated to be valued between $225 billion and $350 billion, with anticipated expansion in the future (Crenn, 2021; Cardebat, 2017). Global wine consumption has been increasing by approximately 3% each year since 2009, leading to changes in regions where wine is consumed. Even though countries like Spain, France, and Italy are seeing a drop in wine consumption, it is expected that emerging markets such as China and the United States will boost their wine expenditure by 35% and 25%, respectively. These two nations are responsible for close to $50 billion in wine consumption, making up about 20% of the worldwide market (Crenn, 2021). This shift can also be seen in the production side, with leading wine labels now originating not just from France, Italy, and Spain but also from nations like the U.S., Australia, and Chile (Cardebat, 2017).

(Cardebat, 2017) highlights that numerous factors influence wine supply and prices. Annual production levels, determined by vineyard yield and the area cultivated, and the quality of production are primary factors. Weather conditions and extreme climatic events can introduce uncertainty into wine supply. For example, climate change has generally led to more exceptional vintages, as noted by (Cardebat, 2017), who points out the increased frequency of outstanding harvests in Bordeaux since the 2000s. This raises the question of whether regions with stable weather will continue to produce superior wines. Despite regions like California benefiting from favorable conditions, establishing a brand remains challenging, creating high entry barriers for new fine wines. Established houses like Château Mouton Rothschild benefit from these barriers, making it difficult for new vineyards in ideal regions to secure investment value (Cardebat, 2017).

Moreover, wine quality can vary over time, and some prestigious estates might prioritize production quantity over quality. These estates, renowned for their terroir, winemaking techniques, and history, can choose whether to sell their wine each year. This variability in supply influences the wine's vintage and reference years, as suboptimal quality can impact a wine's market value and brand prestige (Cardebat, 2017). Consequently, the supply of wine is highly inelastic, with short-term demand fluctuations having minimal effect since supply is determined annually by the harvest and is subject to external factors (Cardebat, 2017).

External influences on wine prices include ratings from experts like Robert Parker, which drive demand for fine wines. Additionally, the value of wine is affected by its aging potential, with premium wines exhibiting a concave price trajectory over time (high demand and limited supply driving up prices) highlighting wine's dual nature as both a consumable product and a speculative investment.

According to Cardebat (2017), wine investment relies on two critical factors. First, the wine must demonstrate value appreciation over time, which depends on the estate's reputation, strong demand, and high expert ratings, such as those exceeding 95/100 from Robert Parker. Liquidity is equally important; an investment wine must be tradeable. If a wine cannot be sold despite a significant price increase, it becomes less valuable as an investment. The liquidity of wine impacts market efficiency, with prices better reflecting available information (Cardebat, 2017). Second, geography plays a role in investment potential. While Bordeaux wines remain the most traded and prestigious, other regions like Burgundy, Tuscany, Champagne, Rhône Valley, California, Barossa Valley, and Ribera del Duero are gaining attention from investors. The diversification of the wine market has led to a reduced market share for Burgundy wines and increased interest in wines from other regions as alternative assets for portfolio diversification (Cardebat, 2017).

Despite this growth, studies by Dimson (2015) and Masset (2015) indicate that wine does not necessarily yield higher returns compared to traditional financial markets when considering high transaction and storage costs. The estimated net annual growth is around 4% from 1899 to 2012, with similar trends observed in recent years, contradicting the strong growth reported by Liv-Ex indices. Additionally, wine volatility can surpass that of stocks and bonds. Research by Cardebat (2016) shows limited diversification benefits of wine, as its returns often correlate with equities, particularly in emerging markets, driven by similar macroeconomic factors. Early studies, such as Jaeger (1981), found Bordeaux reds and California Cabernets outperforming U.S. Treasury bonds by 12.4% with a lower standard deviation. Other studies, including Divittorio (1996) and Bentzen (2002), also confirmed positive returns for Bordeaux wines. Masset (2010) observed a 5.4% annual growth rate for Bordeaux wines from 1996 to 2009, with a standard deviation of 10.33%.

2.3.1.2 Whisky Brora

Similar to wine, whisky is classified according to its place of origin, value, distillery, and other attributes, particularly the premium, high-quality whiskies that will interest collectors and investors. The whiskies tend to appreciate in value over time, hence a good choice for long-term investment. In 2022, about 56,000 bottles of single malt Scotch were purchased at auction, a 23% increase from the previous year (McFadzean, 2022).

The total worth of the auctions held in 2022 was £26.192 million, up from £21.720 million in 2021, a rise of 20.59%. Latest available data show that demand for bottles priced between £100 and £1,000 increased in both quantity and values. The sales of whiskies in the price range increased by around 27,000 to 35,000, an increase of 30%, and their value increased 40% to nearly £10 million. The whiskies priced between £1,000 and £10,000 saw a huge value increase of 28.5% in the previous two years, with volume unchanged. The increase may be due to young investors and collectors with restricted budgets, as well as investors seeking safe investment opportunities offering improved liquidity. In contrast, the sales of bottles above £10,000 increased 28%, but their total value decreased by 10%. This segment of the collection is worth £2.5 million, with some of them like The Macallan Reach selling above £100,000, highest at £300,000 during an auction conducted in October 2022. McFadzean's group places particular focus on tracking the destiny of bottles sold below £10,000 as rising interest rates and inflation could be a danger to this segment. The luxury market for whiskies valued over £10,000 remains fueled by the super-rich.

New advances in whisky research are concerned with the influence of seasons and aging on the spirit's worth. The prices of whiskies aged 3–10 years and 11–20 years have gone up by 7% and 2% to £259 and £302, respectively. The older whiskeys, more than 20 years old, increased by 10% to an average of £757 per bottle. The market is also expected to keep growing due to the regular high valuations and demand (McFadzean, 2022). Sales of whisky are also affected by the changing season, with 28% of total sales made between October and December. Whisky has its peak sale months in May, June, October, November, and December, and they account for 48% of the overall trade value. This timetable aligns with the timetables of established auction houses such as Sotheby's, Christie's, and Bonhams.

Whisky today has more origins than the classical Scotland, Ireland, the US, and Japan, with Canada, France, Germany, Australia, and New Zealand included (McFadzean, 2022; Vingtier, 2013; Larevue, 2024). For regions in Scotland like Campbeltown and Lowlands, value and quantity have risen significantly in the past two years relative to the rest of Scotland. Although Speyside is known for high output in The Macallan distillery, it has also experienced slower growth, with its price per bottle going from £700 to nearly £1,000 in a span of one year. Highland whiskies have recorded steady market shares between 2021 and 2022. Nevertheless, The Macallan remains a force to be reckoned with in auctions, reporting 35% of single malt whisky sales volume and nearly 60% by value (McFadzean, 2022). The Macallan enjoys a 19% volume and 43% value market share in the rare whisky segment, and the market recorded a 22% price increase in 2022, (RareWhisky, 2022) reports. Although prices for Macallan are lower than GlenAllachie, Springbank, or Balvenie, they are still significantly higher than those at other distilleries. Prestige products such as "The Macallan James Bond 60th Anniversary" have generated a significant short-term profit, with original investors seeing their investment triple within weeks (McFadzean, 2022). This reflects the value of prestige editions in the secondary marketplace.

Expert views, the history of the distillery, origin and ageing process of the product, are all going towards the whisky pricing, like in the case of wine. For (McFadzean, 2022), whisky investment appears to have more growth potential than wine investment. In the period 2011 to 2021, the Knight Frank Whisky Index (KFWI) recorded a growth of 428%, but lost 3.5% in 2020. Still, despite the pandemic, Rare Whisky 101's Apex 1000 Index also recorded significant growth, with a near 8% growth in 2020 (Shirley, 2021). Over the recent years, there were really significant increases, like a 38.37% growth in 2016, a 27.51% growth in 2017, and a 30.01% growth in 2018. (Charrel, 2022) also stresses that the £1.45 million sale of one bottle of The Macallan 1926 in 2019 shows the outstanding value appreciation of special whiskies. The Macallan Valerio Adami 1926 sold in October 2018 for £848,750 after being purchased in 2004 for £6,000, which represents a return of 42.43% per annum. Whisky ranks third as a lucrative alternative investment option in the third place as it has seen its value significantly grow, as noted by the Knight Frank Wealth Report (McFadzean, 2022). In spite of a 60% capacity increase in production within 15 years, the whisky market continues to thrive.

2.3.1.3 Watches

The Swiss Watch Industry Federation has data as per which the main customers of Swiss watches are the United States, China, and Hong Kong, importing a total value of over CHF 8 billion worth of Swiss watches. During the years 2019 to 2021, the markets experienced growth of +27.8% (US), +48.8% (CN), and falling by -20.7% (HK). Next are Japan and the United Kingdom with CHF 1.4 billion each. Japan recorded a drop of 11.9% and also the United Kingdom of -2.4%. Globally, the major markets in the watches industry remained unchanged, where Hong Kong takes the lead, followed by the United States and China as second and third. Importation of watches within these nations has grown by +3.8%, +26.9%, and +30.9%. Switzerland heads the export with CHF 22 billion, followed by Hong Kong (USD 7 billion) and China (USD 4 billion). Their average price for exporting watches, however, is widely varied, as Switzerland's average is USD 1,475 per watch, Hong Kong's averages just USD 36, and China's averages at USD 5 (FIH, 2023a).

As far as market share is concerned, Asia dominates Swiss watch exports with practically half (49%), trailed by Europe (30%) and the Americas (19%), while Oceania and Africa each account for a mere 1% (FIH, 2023d). Nonetheless, this distribution may change in the future because Oceania, the United States, and Europe saw a significant growth of +27.1%, +23.9%, and +15.8% from 2021 to 2022, relative to Africa (+5.8%) and Asia (+4.4%).

The secondary market for watches has grown much larger and now approaches the size of the primary market, around $20 billion, as claimed by Muller (2022). The market itself has expanded significantly over the last couple of years, especially following COVID-19, with huge demand for such high-end watch brands as Rolex, Audemars Piguet, Cartier, and Patek Philippe, surpassing available supply. Thus, popular models like the Rolex Daytona, Patek Philippe Nautilus, and Audemars Piguet Royal Oak experienced price hikes in the secondary market due to difficulties in acquiring them from authorized dealers, which created waiting lists of months or years (Muller, 2022; Kronos, 2022).

A report jointly authored by Müller of LuxeConsult and Morgan Stanley cautioned against a speculative bubble in March 2022, forecasting potential price to fall over the next months or years. The increased risks were added to by a flow of speculative consumers, especially from the cryptocurrency market. This forecast was true as both financial and cryptocurrency markets collapsed simultaneously, causing a considerable drop in watch prices since March 2022 (Beyler, 2022).

Despite this, Szegedi (2022) reports that the secondary market is set to keep increasing and hit around CHF 35 billion in 2030, which will mark a 75% growth from the current levels and double the size of the primary market. A number of drivers will fuel such growth, such as Millennials and Gen Z's interest in watches and the principle of circular economy, brands creating their second sales platforms, manufacturing limited editions to ensure luxury, and consumers' willingness to own models no longer in production (Szegedi, 2022; Beyler, 2022).

The value appreciation of a watch is significantly different from whisky or wine since it is not influenced by factors such as outside climatic factors influencing seasonal harvests. On the other hand, a watch brand may pre-determine the number of units to be produced, the target market to be aimed at, and the exclusivity by providing limited edition editions. It is essential to take into account a few vital factors that influence the price of a watch.

Brand reputation is the first factor. To gain or build the worth of a watch brand, it should enjoy a good reputation (Chrono24, 2022; Szegedi, 2022). Scarcity is the second factor. A watch either has to be one of a kind or under a limited edition (Chrono24, 2022; Lendopolis, 2021). Scarcity is a major factor in a watch's possible appreciation. For instance, pre-collector models of bygone years, though no longer in production but still easily obtainable, are less pricey. But as production dwindles, prices for them become vulnerable to rising in the passing years (Lendopolis, 2021). Investment watches have displayed phenomenal appreciation value with appreciation in value directly related to scarcity of production and market timing. The stark contrast in manufacturing philosophy between luxury watchmakers illustrates this adage best. Rolex maintains fairly high-volume manufacture, manufacturing some 800,000 to 1.24 million watches annually (Lendopolis, 2021; Morgan Stanley, 2021; Revolution, 2025). In contrast, Patek Philippe, established in 1839, has maintained the exclusivity through tightly restricting manufacture of approximately 42,000–62,000 watches annually (WatchTime, 2015; WatchProSite, 2013). Such a production culture is evidenced by the (Lendopolis, 2021) observation that Patek Philippe has merely manufactured around 1 million watches in its entire 180-year history—a number Rolex produces today in a single year. This inherent difference in production strategy directly carries over into pricing power and investment opportunity, with scarcity generating collector demand and long-term appreciation.

(Chrono24, 2022) also points out the significance of a brand's presence in the secondary market, like participating in auctions or establishing museums. As the resale market becomes more valuable, brands are forced to become involved in order to make their watches more attractive. According to Deloitte's 2022 research, most brands actively go after managing the value of their watches through buyback programs and manufacturing level control; 37% in both instances (Szegedi, 2022). Also, according to (Szegedi, 2022), about 30% of brands issue limited editions to keep their rarity.

The central factor is the intrinsic quality and beauty of the watch. Its worth is hugely influenced by factors like innovation, material, technical solution, and design (Chrono24, 2022). Background history also influences its value, as seen when Paul Newman's Rolex Daytona was sold for more than €15.3 million in 2018 (Lendopolis, 2021). Finally, the economy must be stable, while credibility and maintenance should not be overlooked. Watches generally need to be serviced after 5 to 7 years, depending on usage, and the authenticity documents have to be kept intact (Chrono24, 2022; Lendopolis, 2021).

The market for watches started picking up pace in 1989 with a celebrity Patek Philippe auction (Chrono24, 2022). Ever since then, the market has grown significantly with online selling and the influence of social media (Chrono24, 2022). Luxe Watches reports that investing in watches has achieved double the profit compared to stock market indices, with Patek Philippe outperforming the S&P 500 and the FTSE 100 (Chrono24, 2022). Some watch models, such as the Patek Philippe Nautilus, Audemars Piguet Royal Oak, and Rolex Daytona, have experienced significant price increases in recent years, particularly during the COVID-19 pandemic, with their prices increasing by more than 200% over the course of a year (Kronos, 2022).

The luxury watch market experienced record growth following the COVID-19 pandemic, with three record years in 2021, 2022, and 2023 as investors and collectors sought out alternative investments in times of economic uncertainty (Monochrome, 2024). But such spectacular growth has also shown the whimsical nature of timepiece investments versus traditional securities. During the period of August 2018 to January 2023, luxury watches like Rolex, Patek Philippe, and Audemars Piguet performed spectacularly with the average yearly appreciation in price being 20%, over double the 8% S&P 500 return for the same period (Luxury Playbook, 2024). But this superior performance was not consistent across all time frames: from 2012 to 2022, the same luxury watchmakers expanded at a mere average of 7% annually compared to the S&P 500's 12% (Bloomberg, 2023).

The market dynamics shifted radically beginning in May of 2022, when secondary market values peaked and then fell on a sustained basis (Robb Report, 2024). By March 2022, the market index was at $97,145 only to decline to $70,400 by January 2023 (ChronoHunter, 2024), with certain models falling by 30% in weeks (Kronos, 2022). The fourth quarter of 2023 was also the seventh consecutive declining quarter for the secondary market (Robb Report, 2024), an indicator of the broader economic pressures like rising interest rates and reduced speculative investment.

Interestingly, market research demonstrates that there are significant segmentation effects in the luxury watch market. (Kronos, 2022) discovered that if Big Three manufacturers' flagship watches were excluded, watch indices would nevertheless show 10% positive annual growth, demonstrating that new references and best-selling catalog items soaked up the blow of investor pullbacks as consumers did not want to pay retail prices to avoid waiting lists at the retailers (Monochrome, 2024). Conversely, aged and non-production models demonstrated remarkable durability and retained nearly all their value during the correction phase (Monochrome, 2024).

Despite the latest market fluctuations, professional experts note the core strength of luxury watches by stating that even after massive declines since 2022, the secondary market prices for Patek Philippe and Audemars Piguet remain approximately 30% above three years ago (Robb Report, 2024). The used watch industry, worth $25–26 billion in 2023, is still expanding at a higher rate than the main market and now accounts for almost one-third of the total luxury watch industry (Monochrome, 2024). This resilience, combined with historical evidence of watch market recovery within two years from the 2007–2009 financial crisis (Dupreelle, 2023), suggests that while luxury watches are extremely short-term volatile, they are long-term investment-worthy for patient consumers.

2.3.1.4 Handbags

The luxury goods market segment of Hermès handbags is special and diversified and is famous for its combination of high fashion, skilled craftsmanship, and exclusivity. Hermès handbags, unlike wine or watches, don't appreciate or depreciate in value according to factors like weather conditions or seasons. Instead, their value is based on a combination of brand reputation, workmanship, rarity, and market conditions.

McKinsey & Company predicts that the luxury handbag market will remain strong globally, and Hermès will be a significant contender in this industry. Hermès handbags, renowned for their impeccable craftsmanship and quality materials, are more than a fashion statement; they are investment pieces. An example would be classic designs like the Birkin and Kelly, whose value has appreciated exponentially through the decades, performing better than stocks as an investment. This trend highlights the bags' status as luxury goods and investment assets.

Hermès handbags are the ultimate example of how brand reputation and exclusivity drive market value. The brand's long history and insistence on excellence in craftsmanship have resulted in their products being highly sought after. Every handbag made by experienced artisans goes through strict quality checking to make sure that it is of superior quality. The focus on detail, in addition to the brand's low production quantities, results in the high market prices of the handbags (Vogue Business, 2024).

The restricted supply of Hermès handbags is another contributing factor to their price. Limited edition drops, made-to-order possibilities, and the house's strategy of managing availability enhance the exclusivity of its handbags. For example, waiting lists for well-liked designs such as the Birkin and Kelly are well documented, so prospective purchasers frequently experience lengthy waiting times (Business of Fashion, 2024). This exclusivity not only makes the handbags more desirable but also guarantees their enduring value.

Market demand is also a propellant in the valuation of Hermès handbags. Even in times of economic slowdown, the luxury fashion market has proved immune to downturn and has continued to see growth, with high-net-worth individuals still purchasing exclusive luxury items. The stability and increasing demand for Hermès handbags are also demonstrated in the secondary market, such as at auction houses and resale websites. Newly published figures show that some Hermès designs have experienced price growth of up to 20% per year, demonstrating their investment value (Christie's, 2024).

The quality of a Hermès handbag is crucial to its worth, along with its brand identity and rarity. Those in good condition, particularly those with their original packaging and proof of authenticity, are more valuable. The resale market prefers handbags in good condition, which describes the need to keep the bag under good care (The RealReal, 2024).

There are a few principal concerns to consider while investing in Hermès handbags. First, it is important to understand the influence of brand and positioning of the brand in the market. Hermès handbags embody fashion and exclusivity. Moreover, investors should take into account market trends and past performances of handbags for investment purposes. Maintaining the condition of the handbag and verifying its authenticity are finally important to safeguard its value and ensure a successful investment (Forbes, 2024).

Hermès Iconic Bags
Birkin
Hermès Birkin Bag
Created in 1984
Starting at €11,400 Up to €450,000+ for special editions
Available Sizes:
  • Birkin 25 (Compact)
  • Birkin 30 (Most popular)
  • Birkin 35 (Spacious)
  • Birkin 40 (Largest)
Craftsmanship: 18-25 hours handcrafting time
Kelly
Hermès Kelly Bag
Created in 1935, renamed in 1977
Starting at €10,800 Up to €300,000+ for special editions
Distinctive Features:
  • Single handle design
  • Turn-lock closure
  • Structured silhouette
  • Detachable shoulder strap
Inspiration: Named after Grace Kelly
Constance
Hermès Constance Bag
Created in 1959
Starting at €9,500 Up to €150,000+ for exotic leathers
Key Characteristics:
  • Sleek crossbody design
  • Iconic H clasp closure
  • Minimalist aesthetic
  • Versatile day-to-night style
Designer: Catherine Chaillet
2.3.1.5 Diamonds

The diamond luxury industry is intricate and dynamic, characterized by its uniqueness, value, and massive market impact. Diamonds are valued based on various factors such as market demand, originality, and quality rather than just fashion trends as with many luxury goods.

Most recent industry reports estimate sustained growth in the global diamond market on the back of robust consumer demand and growing investment demand, as per De Beers Group as of 2023. Investors are increasingly looking at diamonds, especially those with excellent clarity, color, and carat weight, as investment assets. Fine-quality diamonds tend to go up in value, as they are used as money-making assets as well as luxury goods (Rapaport, 2024).

The scarcity of the stones significantly influences the diamond market. There is a ceiling for manufacturing good quality diamonds, and their supply is highly concentrated in the hands of big players in the industry. The scarcity is a major factor in the value and attractiveness of diamonds. An example is diamonds that appear in uncommon colors like blue or pink, which are highly prized and expensive because of their outstanding rarity and beauty.

Market forces also determine the value of diamonds. Despite economic downturns, the luxury industry remains thriving because affluent individuals continue to purchase costly gems. New proof shows that there are some diamonds that have posted yearly gains in prices, making them an investment opportunity (Bain, 2024).

The authenticity and state of diamonds also play critical roles in determining their value in the marketplace. Certified diamonds, especially those valued by reputable institutions, are more costly. Certification verifies the quality and authenticity of a stone to sustain its value in primary and secondary markets.

To invest in diamonds, an individual must know a few important things. Firstly, understanding the impact of market trends and the past prosperity of diamonds can help in decision-making. Secondly, the need to understand the quality and genuineness of the diamond exists so that the value is retained, and an investment return is available. Lastly, understanding shifts in the industry can benefit the investors in making rational decisions (Forbes, 2024).

In summary, diamonds constitute a very large share of the luxury market, as rarity, trends in the market, and certification all contribute to increasing their value. That they can be viewed both as luxury goods and as investment commodities continues to attract collectors and investors seeking both aesthetic value and monetary gain.

Historic Diamonds
Cullinan
Cullinan Diamond
Discovered: 1905, South Africa
Original Weight: 3,106 carats Largest gem-quality rough diamond ever found
Main Cuts:
  • Cullinan I: 530.2 carats (Great Star of Africa)
  • Cullinan II: 317.4 carats
  • Cullinan III: 94.4 carats
  • Cullinan IV: 63.6 carats
Location: British Crown Jewels
Pink Star
Pink Star Diamond
Discovered: 1999, Africa
Sold: $71.2M (2017) Most expensive diamond ever sold
Specifications:
  • Weight: 59.6 carats
  • Color: Vivid Pink
  • Clarity: Internally Flawless
  • Cut: 2 years of work
Origin: De Beers
Blue Moon
Blue Moon Diamond
Discovered: 2014, South Africa
Sold: $48.4M (2015) Record price per carat
Characteristics:
  • Weight: 12.03 carats
  • Color: Fancy Vivid Blue
  • Shape: Cushion Cut
  • Clarity: Flawless
  • full name: Blue Moon of Josephine
Current Owner: Joseph Lau
Hope Diamond
Hope Diamond
Origin: 17th Century, India
Weight: 45.52 carats Type IIb Blue Diamond
History:
  • Discovered in Golconda Mines
  • Owned by Louis XIV
  • Surrounded by 16 white diamonds
  • Famous for its "curse" legend
Location: Smithsonian Institution
2.3.1.6 Classic Cars

The classic car market is a distinct and special segment of the universe of valuable assets, marked by its historical value, visual appeal, and investment potential. Value in classic cars is established by several factors such as rarity, historical value, condition, and demand in the market.

Recent research reports suggest that there is considerable growth in the classic car industry, driven by rising demand from collectors and investors (Hagerty, 2023). Classic cars, especially those from well-known brands such as Ferrari, Aston Martin, and Porsche, are being considered good investment vehicles. Old cars from these brands have shown incredible appreciation in their worth over time, quite often outperforming returns on most investments like real estate and equities (Gooding, 2024).

Rarity is key to making old cars valuable. Production runs that are limited, rarity, and historical significance enhance the value and attractiveness of these vehicles. Classic Ferraris such as the 250 GTO, Porsche 911 Carrera RS, and Aston Martin DB5 are also highly prized for their rarity and superior lineage, according to (RM Sotheby's, 2024). The models tend to fetch a premium price in auctions since they are widely respected in the market.

Following economic fluctuations, the vintage car market has remained resilient. Rich people still invest in old cars, which are drawn by their distinct charm and history. Recent data demonstrate that some vintage cars have recorded yearly price growth, which shows their high investment value and long-standing popularity (Bonhams, 2024). The results of auctions typically depict a huge appreciation in value for Ferraris, Aston Martins, and Porsches because they establish their resilience in the market.

The value of classic cars largely depends on their history and condition. Well-maintained cars with original parts and complete documentation are highly worth it. To help maintain its value and facilitate sales in the second-hand market, one should have a certificate of authenticity in addition to full documentation of a car's history (Classic Car Restoration, 2024).

To invest in classic cars, one needs to know about market trends and performances of the models in the past. Investors need to know the condition and origin of the vehicles and be aware of industry news and auction results so that they can make the appropriate investment choices (Forbes, 2024). Classic Ferraris, Aston Martins, and Porsches represent the blend of luxury, speed, and financial value and are still favorite among investors and collectors.

Iconic Classic Cars
Ferrari 250 GTO
Ferrari 250 GTO
Produced: 1962-1964 (36 units)
Record sale: $51M+ Most expensive car ever sold
Specifications:
  • 3.0L V12 Engine
  • 300 HP
  • Top Speed: 280 km/h
  • Aluminum Body by Scaglietti
Achievement: Italian GT Championship 1962
Porsche 911 Carrera RS 2.7
Introduced: 1972 (1973 Model Year)
Market Value: €500K-€1.5M First production car with rear spoiler
Specifications:
  • 2.7L Flat-Six Engine
  • 210 HP at 6,300 rpm
  • 0-60 mph: 5.8 seconds
  • Top Speed: 150 mph
Innovation: "Ducktail" Spoiler Design
Aston Martin DB5
Aston Martin DB5
Introduced: 1963
Market Value: €800K-€2M+ James Bond's iconic car
Specifications:
  • 4.0L Straight-Six Engine
  • 282 BHP
  • 0-60 mph: 8.0 seconds
  • Top Speed: 145 mph
Legacy: Featured in Goldfinger (1964)
2.3.1.7 Sneakers

The vintage and limited-edition sneaker market has become a dynamic one within the larger fashion and luxury industries. Sneakers, once seen as strictly functional, are now hot items with potential for fashion, heritage, and profitability. Timeless designs of top-selling models of leading brands such as Nike, Adidas, and Air Jordan are coveted assets in this niche market.

Nike has solidified its position as a leading participant in the sneaker industry, with retro models such as the Air Jordan 1 and the Nike Air Max family remaining in high demand. The sneakers are highly sought after because of their appearance, history, and connection to cultural trends. Limited drop releases and endorsement collaborations with popular designers and celebrities have further increased their desirability and value as investments (StockX, 2024). Nike's emphasis on exclusivity and innovation remains a part of making its classic sneakers more valuable.

Adidas has been a key player in sneaker history by creating such iconic models as the Stan Smith and the Superstar. Adidas sneakers hold value because they are evergreen in design and because they impacted sports history and fashion history so much. Sealed releases and limited-edition collaborations add to their attractiveness, making them highly valuable as collectible items to desire (Sole Collector, 2024). Adidas's commitment to quality and its legacy history are major factors in the sustained popularity of its timeless sneakers.

Nike's subsidiary line, Air Jordan, is now commonly known for its impact on the sneaker culture. The Air Jordan 1 in 1985 remains the cornerstone of sneaker culture. Its connection with basketball icon Michael Jordan and sneaker heritage both account for its extremely high market value (Complex, 2024). Limited release of some releases and the scale of cultural moments still fuel the popularity and financial investment in Air Jordan sneakers.

The secondary market for rare sneakers has experienced a huge surge due to fashion, celebrity culture, and the growth of sneaker culture. Limited-edition and rare sneakers have recorded significant price appreciation in auction rooms and online resale platforms. Current studies show that some sneakers have risen in value by as much as 30% per year, which is a testament to their investment value (Christie's, 2024). StockX and GOAT are key sites in the growth of the resale market for sneakers through facilitating the transactions and pricing the market value.

The value of collector sneakers relies largely on their state and authenticity. Sneakers that are in perfect condition, complete with original box and verification, fetch higher prices. Well-conditioned sneakers are treasured in the secondary market, focusing on upholding the integrity of the pairs. Certification and full documentation are needed to warrant value and authenticity during transactions.

To venture into traditional and vintage sneaker investments, one has to learn about market trends, brand power, and past results. Investors must track new drops, collaborations, and cultural shifts that drive the value of sneakers. Additionally, care must be taken to preserve the condition and ensure authenticity in order to retain value and make profitable gains (Forbes, 2024; OpenAI, 2025).

Iconic Sneakers
Air Jordan 1
Nike Air Jordan 1
Introduced: 1985 by Peter Moore
Original Price: $65 Current Value: Up to $500K+ for rare editions
Key Features:
  • Nike Air Cushioning
  • Premium Leather Construction
  • Iconic "Wings" Logo
  • Original "Bred" & "Chicago" Colorways
Legacy: First Michael Jordan signature shoe
Nike Air Max
Nike Air Max Series
Introduced: 1987 by Tinker Hatfield
Original Air Max 1: $75 Rare editions: $1K-$20K+
Iconic Models:
  • Air Max 1 (1987): Visible Air Unit
  • Air Max 90: Larger Air Unit
  • Air Max 95: Gradient Design
  • Air Max 97: Full-Length Air
Innovation: First visible Air cushioning
Adidas Stan Smith
Adidas Stan Smith
Introduced: Early 1970s
Retail: €95-€120 Limited Editions: Up to €1000+
Design Elements:
  • Full-Grain Leather Upper
  • Perforated 3-Stripes
  • Rubber Cupsole
  • Signature Green Heel Tab
Evolution: Now includes sustainable materials
Adidas Superstar
Adidas Superstar
Introduced: 1969
Retail: €100-€150 Rare editions: Up to €2000+
Signature Features:
  • Iconic Shell Toe
  • Premium Leather Upper
  • Herringbone Outsole
  • Classic 3-Stripes Design
Cultural Impact: Run-DMC's signature shoe
2.3.1.8 Art

Significant changes in the art market occurred in the 20th century due to the rise of modern art movements like Impressionism, Cubism, and Abstract Expressionism. These questioned conventional ideas of art and broadened the market to incorporate fresh forms and styles. The creation of well-known auction houses such as Sotheby's and Christie's were vital in legitimizing the art market and breaking sales records for pieces by artists such as Vincent van Gogh and Pablo Picasso.

The worth of art is not subject to external factors, unlike commodities like wine or whisky which can be affected by things like seasonal weather conditions impacting harvests. Rather, art's worth is determined by an intricate combination of artistic quality, market forces, and cultural importance. Below are several important factors that impact the market value of art. One could argue that the artist's reputation is the most crucial element. Famous artists who have had a significant historical or cultural influence usually have artworks that demand higher prices. Young artists who are starting to receive recognition can experience a quick rise in the worth of their creations. An artist's market value is greatly impacted by their representation in exhibitions, galleries, and public collections (Art Market Monitor, 2022).

Limited editions impact the cost of watches, just like the ownership history and scarcity of an artwork are significant factors. Items with a clearly documented history, particularly those previously owned by famous collectors, typically command higher prices when sold at auctions. Moreover, items that are rare or one-of-a-kind, such as those created during an artist's significant time frame, are likely to increase in worth (Christie's, 2022).

The value of an artwork can be greatly increased by its cultural and historical significance. Art pieces belonging to important art movements or representing key historical events are typically more in demand. This element is like the way in which watches linked to famous figures or historical events increase in worth as time goes by (Sotheby's, 2023).

Like other high-end offerings, the art market is influenced by larger economic factors. In times of economic growth, the prices of art typically increase due to collectors having greater disposable income. On the other hand, in times of economic decline, prices could stay the same or go down. Nevertheless, art is frequently viewed as a secure investment option amid economic instability, resulting in continued demand for top-notch artworks even in times of financial downturns (Dupreelle, 2023).

The genuineness of a piece of art is crucial. Items with valid authentication papers or confirmed by specialists in the industry are of higher worth. Just like the condition of the artwork is important, well-maintained pieces, especially older ones, can fetch higher prices than pieces needing restoration (Art Basel, 2022).

Current valuations can be influenced by previous auction results of comparable works by the same artist or within the same genre. An impressive auction record can set a standard for upcoming sales, leading to increased prices due to collectors vying for similar items (Phillips, 2023).

In the end, the emotional and aesthetic appeal that is subjective in an artwork should be considered. In contrast to watches or whisky, where technical precision and taste are important, art's visual and emotional impact can be the main factor in driving demand. Artworks that strike a chord with collectors or mirror present-day cultural themes could experience substantial increases in value in the future (ArtNewsPaper, 2022; OpenAI, 2025).

2.3.1.9 Gold

The gold market is an important component of the luxury and finance industries, with a long history of being an asset conservator and one that has maintained popularity as an investment over time. Many factors affecting the price of gold, including world economic fluctuations, geopolitical stability, and market demand, make it an exceptional and highly valued commodity.

Gold demand is regulated by different sectors including jewelry, technology, and investment. Central banks are a key player in the market to buy gold to diversify their holdings. It has been stated by (World Gold Council, 2024) that there is still strong global demand for gold, especially from growth economies, and consistent interest in gold as an insurance asset amidst economic uncertainty.

Gold is widely seen as a hedge against inflation and currency value volatility. Its price is affected by interest rates, geopolitical tensions, and macroeconomic trends. Based on history, gold has consistently maintained its value and even performed better than other assets during economic recessions (Goldman Sachs, 2024). The prolonged popularity of gold as an investment rests on its scarcity and physical properties.

Past years have also seen unprecedented volatility in the gold market in line with overall economic movements and investor sentiment. Based on a recent study, gold prices have appreciated owing to enhanced economic uncertainties and market volatility (Bloomberg, 2024). Demand remains strong and interest is still present in the secondary gold market that comprises trading exchanges as well as bullion dealers.

Gold's quality is based on its purity level and state of preservation. Highly pure gold coins and bars in a preserved state tend to fetch high prices. Certificate and assay reports are crucial in establishing the quality and authenticity of gold, which could affect its market value (Kitco, 2024).

The purchase of gold requires knowledge of market trends, economic conditions, and geopolitical influences. Investors need to be aware of the risk and market volatility of investing in gold. (Forbes, 2024) strongly advocates diversification and long-term investment to reduce risks and take advantage of gold's value storage potential (OpenAI, 2025).

Chapter 3: Methodology

3.1 Research Design & Hypotheses

The financial behavior of collectibles in connection to traditional investment markets is examined in this thesis. The following theories are put forth and empirically examined using excess logarithmic returns, drawing on earlier studies on asset diversification, brand equity, and the alternative investment environment.

3.1.1 Hypotheses

H1: Manufacturer-Collectible Correlation Hypothesis There is a positive linear correlation between collectible assets and the publicly traded stocks of the companies that make those brands. This illustrates how corporate performance and secondary market valuations are positively correlated, with stronger brand equity supporting higher resale values and investment interest in collectibles.

H2: The Linkage Hypothesis between Collectibles and Manufacturers Measurable linear relationships establish a systematic relationship between collectible asset returns and their manufacturer stocks. This investigates whether changes in corporate equity can be reliably translated into changes in collectible value and whether the performance of manufacturer stocks can be used to forecast collectible market behavior.

H3: Hypothesis of Broader Market Correlation Gold, digital assets, and certain stock market indices are all correlated with collectibles. Theoretically, collectibles can be either market-sensitive assets that move in tandem with larger financial cycles or alternative stores of value that, depending on the market, may correlate with established safe-haven assets like gold or new digital assets like Bitcoin.

H4: Hypothesis of Wider Market Linkage Through methodical predictive relationships, collectible markets are linearly connected to specific stock market indices, gold, and digital assets. Through quantifiable regression relationships, this hypothesis examines whether broader financial market indicators, such as the MSCI World Index, S&P Global Luxury Index Total Return, Gold Futures, and Bitcoin, can consistently forecast collectible performance.

3.1.2 Methodological Approach

Using the pertinent market indices or asset classes as independent variables and collectible categories as dependent variables, each hypothesis is investigated using both linear regressions and correlation analysis with Pearson correlation coefficients. P-values at the 5% level are used to determine statistical significance, and R² and beta coefficients provide additional information. Collectibles' place in contemporary portfolios is addressed by the dual approach, which looks at both manufacturer relationships and general market dynamics. It tests whether collectibles serve as market-neutral alternatives or show recurring relationships with both traditional and alternative financial assets.

3.2 Stock markets indices

3.2.1 Databases: indices data extraction

This study primarily used four key indices to lay a solid and comparable basis for assessing the investment performance of luxury collectibles: the MSCI World Index, which tracks the performance of the broad equity market in both developed and emerging economies; the S&P Global Luxury Index Total Return, which tracks publicly traded luxury companies; Gold Futures (COMEX: GCF), which represents a historical store of value; and Bitcoin, which is included as a representative digital asset. The calculation and comparison of risk-adjusted returns, volatility, correlations, and the potential for portfolio diversification were all based on these four benchmarks.

Although they were not consistently incorporated into the primary comparative framework, a larger collection of regional and international equity indices was examined concurrently to aid internal evaluations and contextual comprehension. The S&P 500 (United States), Bovespa Index (Brazil), S&P/TSX Composite Index (Canada), and IPC Mexico are among the indices examined from the Americas. The FTSE 100 (United Kingdom), CAC 40 (France), DAX (Germany), EURO STOXX 50 (Eurozone), OMX Stockholm 30 (Sweden), AEX (Netherlands), and IBEX 35 (Spain) are the European indices that are being studied. Indexes like the Nikkei 225 (Japan), ASX 200 (Australia), Taiwan Weighted Index, Hang Seng Index (Hong Kong), SSE Composite Index (China), KOSPI (South Korea), and SENSEX 30 (India) were used to represent the Asia-Pacific region. Additionally, the 13-week U.S. Treasury Bill was incorporated as the proxy for the risk-free rate, enabling the calculation of Sharpe ratios and excess returns.

To guarantee accuracy, consistency, and cross-market comparability, all data were taken from reliable financial sources, such as Yahoo Finance. The inclusion of this extended set allowed for a deeper understanding of macro-financial trends, regional dynamics, and market-specific characteristics that could impact the performance of luxury assets and investor behavior during the 2015–2025 period, even though the primary analysis was centered on the four central indices.

3.3 Collectibles

3.3.1 Collectibles status; Hermès Kelly Bag, Nike Air Jordans example

There has been a wide range of high-end products that moved from their original roles as use-based or status-driven consumer goods to well-established collectibles. A collectible asset is a physical product for which market value is driven predominantly by cultural significance, scarcity, provenance, and investor and collector demand, and not entirely by its use-based purpose (Velthuis, 2005; McAndrew, 2014; Knight Frank, 2023; Deloitte, 2023). This evolution is the result of several converging forces. First, all these commodities have earned added cultural capital (Bourdieu, 1984; Velthuis, 2005) as markers of taste, connoisseurship, and identity. Second, emerging scarcity, either through limited production, vintage worth, or historical provenance, has made them more desirable and of greater investment value (McAndrew, 2014). Third, passion asset financialization has gained pace, with market indices such as Knight Frank Luxury Investment Index, Liv-ex Champagne 50, IDEX Diamond Index, and Rare Whisky 101 providing transparent market benchmarks and developing a picture of these commodities as legitimate alternative investments. Fourth, globalization of demand for essential assets across the globe—particularly from emerging markets—has widened collector bases and intensified global competition for key assets (Knight Frank, 2023). Finally, digital platforms and greater market transparency—such as StockX for shoes, WatchCharts for timepieces, and auction house databases—have also legitimized these markets further by raising visibility and ease of access to price discovery (Rare Whisky 101, 2024; Liv-ex, 2024; IDEX, 2024; StockX, 2024; Watch Charts, 2024).

To analyze the process of evolution from products to collectible assets, this study utilizes a stage model of collectible status formation, structured through four phases: Launch, Latency, Popularity Boom, and Maturity. The decision to conceptualize collectible status as the dependent variable is also informed by the inherent time lag in such an evolutionary process. Evolution from a typical product to an extremely sought-after collectible tends to occur incrementally over these phases. During the Launch stage, a product is introduced in the market, usually as a functional or status good with no real collectible value immediately. During the Latency stage, cultural significance, passion from consumers, and secondary market indications begin, with whole status as a collectible still being limited. In the Popularity Boom stage, market forces evolve faster: auction activity grows, public exposure grows, and the economic and cultural value of the product becomes a common understanding. Finally, in the Maturity stage, the acquired collectible status of the product is completely integrated into brand identity and market behavior, leading to steady demand and greater symbolic capital. This delayed feedback cycle, in which collectible status develops incrementally over time, supports the appropriateness of using the collectible asset as the dependent variable in this research study's analysis. The next table demonstrates the use of this model within the chosen modern collectible types.

3.3.2 The Evolution of Collectible Status

Two iconic products, the Hermès Kelly bag and the Air Jordan sneakers, serve as prime examples of the clear evolutionary pattern that turns luxury goods into collectible investments. Both items show how four different stages of development can transform functional or status products into sophisticated investment assets.

Launch Stage

Originally known as the "Sac à dépêches," the Hermès Kelly bag gained its iconic status and name in the 1950s when Grace Kelly wore it on the cover of LIFE magazine in 1956 (Hermès, n.d.; Vogue Business, 2024). In a similar vein, Nike entered the basketball endorsement market with the official 1985 release of the Air Jordan 1, launching one of the most iconic sneaker lines in history (Forbes, 2024; Complex, 2024).

Latency Stage

The Kelly bag served more as a luxury accessory than a collectible investment during the latency period, which spanned the 1950s to 1980s. Even though it remained a high-end handbag, its presence at auction and secondary market activity were low during this time (Christie's, 2022; Knight Frank, 2019b). From 1985 to 2000, when they were mostly worn as performance basketball shoes, Air Jordans went through a similar latency period. Even though there was an early sneaker resale market, it was unorganized and only made up a small portion of the larger athletic footwear market (Forbes, 2024; Complex, 2024; StockX, 2024).

Popularity Boom Stage

Kelly bags experienced a surge in popularity in the 1990s and 2000s, which was typified by a rise in auction activity and expanded media attention to luxury handbags as investments (Christie's, 2022). During this time, the bags were featured in Knight Frank reports and became well-known in the world of luxury investing (Knight Frank, 2020; McKinsey & Company, 2023; Vogue Business, 2024). The peak for Air Jordans came between the 2000s and 2010s, when the market for used sneakers grew rapidly. In addition to auction records showing notable price increases for rare and vintage models, this era was characterized by the establishment of StockX and other resale platforms (StockX, 2024; Sotheby's, 2023; Forbes, 2024; Statista, 2023).

Maturity Stage

Both products are now fully developed as acknowledged collectible investments. Now regarded as a "investment handbag," the Kelly bag routinely fetches high prices at auction and is regularly monitored in the Knight Frank Luxury Investment Index and other industry publications (Knight Frank, 2023; McKinsey & Company, 2024; Robb Report, 2024). Similar to this, Air Jordans have gained acceptance as authentic collectibles. They have performed well in resale indices and auction houses, with some models fetching prices comparable to those of conventional investment assets (StockX, 2024; Sotheby's, 2023; Knight Frank, 2023).

This evolutionary framework shows how cultural significance, scarcity, media attention, and the emergence of transparent secondary markets drive the transformation of luxury goods from useful products to complex investment vehicles. This collectible evolution process is universal across various luxury segments, as evidenced by the parallel development of these two very different product categories.

3.3.3 Champagne

This study used the Liv-ex Champagne 50 Index, a reliable and well-recognized stand-in for the most actively traded sector of the fine Champagne market, to evaluate Champagne's performance in relation to luxury collectibles. Although LVMH-owned flagship houses like Dom Pérignon, Krug, and Veuve Clicquot are of primary interest, it is not practical to create an index specifically for LVMH-owned Champagnes. Because it captures market performance through a diverse and liquid basket of prestige cuvées, the Champagne 50 index provides the best approximation currently available.

The London International Vintners Exchange, or Liv-ex, is a respectable marketplace that has been offering transaction-based pricing data on the most traded fine wines worldwide since 2000. The 50 most recent physical vintages from roughly 15 top prestige Champagne houses make up the Liv-ex Champagne 50. Depending on availability and market liquidity, up to ten vintages may be used to represent each top cuvée. To guarantee representativeness and alignment with the exchange's current trading activity, the index is examined and rebalanced every three months.

Using this methodology, the Champagne 50 Index was chosen for its relevance in capturing the investment profile of premium Champagnes, including those in LVMH's portfolio, as well as its transparency and liquidity.

The Liv-ex Champagne 50 Index has been embraced as a reliable and generally recognized stand-in for the high-end Champagne market since it is currently impractical to create a specific index that tracks only LVMH-owned Champagnes. The 50 most recent physical vintages from roughly 15 top prestige cuvées, such as Dom Pérignon, Krug, and Veuve Clicquot, are included in this index. Depending on availability and market liquidity, up to ten vintages may represent each top cuvée. Liv-ex recalculates and rebalances the index every three months to reflect current exchange trading.

Based on modeled vintage slot allocations across Dom Pérignon, Krug, and Veuve Clicquot, our study calculates that LVMH-owned Champagnes make up roughly 38% of the index composition in this context. This indicates a high level of ownership concentration, as no other producer makes a comparable contribution to the index.

Champagne is not specifically included in or performance at the brand level is not distinguished by other well-known luxury indices, such as the Knight Frank Luxury Investment Index or Rare Whisky 101, which are used to benchmark broader passion assets. Therefore, the only market-validated index that offers price-based tracking of LVMH's Champagne brands in a structured investment framework is still Liv-ex. Despite the fact that Dom Pérignon and Krug are offered in Christie's and Sotheby's fine wine auctions, auction houses do not provide systematic performance benchmarks or quantitative indices.

Champagne and Wines make up about 40–45% of LVMH's Wines & Spirits division, with Champagne alone making up 80–85% of this segment, according to consensus analyst estimates (UBS, 2024; Bernstein, 2024). The majority of the remainder is made up of spirits and cognac, with Hennessy at the top and Belvedere and Glenmorangie in the background. According to this allocation, Champagne's share of LVMH's overall group profit in 2023 was estimated to be between 4 and 5%.

3.3.4 Whisky

This study used the RWB-Brora-Index Values, which were obtained from Rare Whisky 101, a well-known website that specializes in secondary market data for rare Scotch whisky, to analyze the performance of collectible whisky as an alternative investment. We concentrated on the Brora subset rather than using the more general and often adjusted RW Apex 100 Index, which is constantly rebalanced in reaction to short-term price volatility. Since the index is made up of a fixed basket of expensive, historically significant bottles from the now-closed Brora distillery—one of the most recognizable brands in the world of collectible whisky—its consistency and stability serve as the justification for this choice. A more accurate evaluation of long-term value retention and price behavior was made possible by this targeted approach.

3.3.5 Watches

Thanks to increased transparency, worldwide demand, and data accessibility, the luxury watch secondary market has developed into a very dynamic investment segment. This study uses a systematic approach based on secondary market pricing data to evaluate watches as alternative investment assets. The approach mostly uses WatchCharts, a platform that offers transaction-based, daily-updated indices, along with contextual assistance from Chrono24, the top online marketplace for luxury timepieces worldwide.

WatchCharts provides a range of indices based on observed transaction prices from auction houses, peer-to-peer platforms, and commercial marketplaces that track the watch market as a whole as well as particular luxury brands. These indices provide high granularity in capturing trends in volatility, resale strength, and value appreciation and are routinely recalibrated. With over 570,000 watches listed and over €2 billion in annual transaction volume, Chrono24 offers a supplementary macro view. Chrono24 is an essential reference point for verifying market liquidity and validating pricing trends seen in index data because of its global reach, pricing transparency, and market footprint.

WatchCharts brand-specific indices

Analyzing brand-specific indices that WatchCharts has put together is a crucial component of this study. These indices track the pricing patterns of used models linked to some of the most well-known and traded brands in the market. They are frequently adjusted to reflect current market conditions and are based on both recent and historical transactions.

The brand indices for Omega, Cartier, IWC, Jaeger-LeCoultre, Vacheron Constantin, TAG Heuer, Hermès, Montblanc, Breguet, and LVMH are among those incorporated into this study. In order to guarantee statistical robustness, these maisons are frequently traded on the secondary market. These indices are trustworthy instruments for assessing comparative brand performance because the WatchCharts methodology guarantees consistency across them. The index for each brand monitors price changes over time and identifies variations in volatility and long-term value retention in the market for collectible watches. Because WatchCharts data is consistently available for these brands, comparisons can be made not only within the watch category but also with other collectible asset classes that were assessed for this study.

Independent prestige brands in the secondary market

A number of independent maisons that produce watches that are considered the best in horological craftsmanship and have solid investment reputations are included in the luxury watch market in addition to the major corporately affiliated brands. These brands dominate the high-end collectible market and merit independent study, despite not being affiliated with publicly traded parent companies.

WatchCharts indices for Audemars Piguet, Patek Philippe, Rolex, and A. Lange & Söhne are included in this study. When it comes to auction visibility, collector demand, and resale value, these four brands routinely rank among the best. They frequently outperform their corporately affiliated counterparts due to their high levels of liquidity and price resilience, even though they are not connected to public capital markets. For example, Audemars Piguet's Royal Oak models and Rolex's Daytona and Submariner references have seen significant value increases recently, especially during uncertain market times.

When there is no stock market representation, these brand-specific indices act as crucial comparators within the broader asset class, showing how heritage, cultural standing, and scarcity all contribute to long-term value. In order to guarantee consistency in data analysis and dependability in interpretation, WatchCharts tracks these brands using the same methodological rigor that is applied to other brands.

3.3.6 Handbags

Handbags, especially those made by Hermès, stand out among the many luxury collectibles this study looks at because of their remarkable capacity to hold their value over time and, in certain situations, increase it. Because of its established performance in the secondary market and its ongoing dominance in terms of both culture and finances, Hermès was chosen for in-depth examination. Hermès continuously attains the highest average resale value in relation to its original retail price, per Rebag's 2023 Clair Report. This trend is best illustrated by signature models like the Birkin, Kelly, and Constance, which exhibit strong liquidity, limited supply, and strong market demand. Hermès is a prime example of examining the investment potential of designer handbags because of these features.

This study used data from Collector Square, specifically the LuxPrice-index, a reference tool that gathers historical pricing data from roughly 400,000 auction results over a 15-year period, to create a solid foundation for analysis. Although not all-inclusive, the data provides a representative sample of Hermès transactions and is sourced from major international auction houses. Based in Paris, Collector Square is a prominent platform in the luxury resale market, specializing in authenticated pre-owned luxury items like jewelry, watches, and handbags. The business, which provides data-driven insights into the resale market to a global clientele, has gained credibility for its exacting valuation and authentication procedures.

The LuxPriceIndex Hermès Birkin, LuxPriceIndex Hermès Kelly, and LuxPriceIndex Hermès Constance data streams were used in this study to analyze three different Hermès models: the Birkin, Kelly, and Constance. A targeted analysis of price changes across various handbag lines within the same brand was made possible by these model-specific indices. The Constance has seen significant appreciation in recent years, especially in limited or exotic editions, while the Birkin continues to be the best performer in terms of resale value, closely followed by the Kelly, according to internal reporting from Collector Square (2024a, 2024b, and 2024c).

3.3.7 Diamonds

A complicated and largely unknown area of alternative investing is represented by diamonds. Numerous factors, such as carat weight, clarity, cut, and rarity, as well as more general supply-demand dynamics related to mining output and trends in luxury consumption, affect their valuation. In recent years, a number of pricing indices have been developed to offer transparency and monitor the changes in diamond prices, especially for natural diamonds in both polished and rough forms.

The IDEX Diamond Index is the only empirical analysis used in this study, despite the fact that it initially examined a wide range of data sources, such as the Zimnisky Global Rough Diamond Price Index, the Antwerp Diamond Index via KRIS Diamonds, and market insights from the Gem & Jewellery Export Promotion Council and Mining Review Africa.

The most reliable, regularly updated, and methodologically transparent benchmark for polished natural diamonds is provided by the IDEX Diamond Index, which is kept up to date by IDEX Online and created in collaboration with Dr. Avi Wohl of Tel Aviv University. It is one of the most thorough and up-to-date indicators of market movements in the polished diamond industry since it compiles inventory data going back to 2001 and is updated hourly. Additionally, it gains from integration with Israel Diamond Institute data, which offers sectoral context and more granularity.

Data availability and quality were taken into consideration when deciding to only use the IDEX Diamond Index. In contrast to other indices, IDEX provided the most structured documentation of index construction and update frequency, as well as the most dependable long-term historical series that corresponded with the study's time frame.

It's also crucial to remember that the IDEX and all other indices cited in this study only concentrate on natural diamonds. Due to different production economics and price behavior, the quickly expanding market for lab-grown diamonds is usually not included in these benchmarks and is tracked independently.

The IDEX Diamond Index was chosen as the only data source for the diamond asset class in this study due to its reliability, openness, and conformity to the research goals and methodological standards used for other asset classes, even though a number of sources were examined to comprehend the larger pricing environment and market structure.

3.3.8 Classic cars

In the world of investing in collectibles, classic cars are a very visible and emotionally appealing category. Despite the market's low liquidity in comparison to other physical assets, its standing as a profitable investment segment has been solidified by high-profile sales and a strong brand heritage. Three brands—Ferrari, Porsche, and Aston Martin—are the main focus of this study's classic car analysis, which uses a combination of curated auction data and specialized market indices.

The K500 Index, a well-known benchmark for monitoring the performance of the vintage car market, serves as the basis for the analysis. The K500, which was created using tens of thousands of verified auction results, combines information from 500 distinct cars to provide a representative picture of market trends. The market's varied behavior is demonstrated by the fact that while some cars have seen notable appreciation, others have either depreciated or stagnated. The study uses K500 Ferrari sub-indices, which are divided into Pre-1958, 1958–1973, and Post-1973 categories, for brand-specific evaluation. These sub-indices represent the historical and collector-driven value stratification within Ferrari's production history. This segmentation provides a more nuanced understanding of investment behavior in Ferrari cars by capturing changes in value over time and across model lineages.

The K500 Porsche Index, which tracks price changes for a carefully chosen range of Porsche models, is also included in the analysis concurrently. This index provides information on long-term brand strength and demand variability by reflecting both collector-grade and enthusiast-level vehicles. Porsche's significance in the comparative framework is influenced by its timeless appeal and comparatively wider market access than Ferrari.

Pricing Culture's Aston Martin Index (CLTBASTMA) data is used in the study for Aston Martin. A representative picture of market behavior is made possible by this index, which incorporates data on both rare and frequently traded Aston Martin models.

Although investing in classic cars typically entails fewer transactions and longer holding periods, the data that is currently available indicates that some models, particularly those from the Ferrari, Porsche, and Aston Martin brands, have the potential to yield significant returns. Well-known indices like the K500 and Pricing Culture, which are based on validated auction data, are used to make sure that the study's analysis accurately captures market conditions and takes collector sentiment and scarcity into account.

3.3.9 Sneakers

From practical sportswear, sneakers have developed into a unique and quickly expanding asset class in the collectibles market. Cultural relevance, scarcity, and high social media and digital resale platform engagement are what make them so appealing. Given its steady dominance in sneaker sales worldwide, strong brand equity, and prominent position in the secondary market, Nike stands out as the most sensible topic for analysis within this domain.

Numerous market data points to Nike's dominance. With yearly footwear sales of over $29 billion, more than twice that of its closest rival, it had the biggest worldwide share in the sneaker market as of 2022. Nearly half of sneaker buyers in the US say they prefer Nike, giving the company a resounding majority of consumer preference. American teenagers rank it as the most popular brand for both clothing and footwear, demonstrating its particularly strong appeal among younger demographics. Additionally, Nike has an unrivaled presence in the resale market, with high-profile partnerships and limited-edition releases regularly fetching high resale multiples. Iconic models such as the Air Jordan 1, the Air Force 1, and various collaborative editions have become hallmarks of the collectible sneaker category.

This study only uses the CRWDSNKR Index, a composite pricing benchmark created by Pricing Culture, to measure and assess the performance of sneakers as investment assets. High-end and culturally significant Nike sneakers are the main focus of this index; many of these are owned on fractional ownership websites like Rares and Rally Rd. A small number of historically and financially significant models form the foundation of the CRWDSNKR Index. These include the AJ1typs collection, which compiles vintage Jordan 1 styles; the 2010 Air Force 1 HOV, a unique partnership with Jay-Z; the GOATs, a thematic collection of high-performing releases; and the 1985 Air Jordan 1 Chicago, which is considered to be one of the most iconic sneakers ever made. The index also features the Jordan 1 OG Low in metallic blue, a very unusual crossover item, and the Apple sneaker from the 1990s. Last but not least, the collection features Adidas' most significant release of the previous ten years, the Yeezy 350 series, which ran from 2015 to 2020.

The Yeezy 350's inclusion recognizes Adidas's cultural significance during the Kanye West era, despite the index being primarily made up of Nike models. Every element of the index was chosen with consideration for rarity, cultural value, resale velocity, and past auction performance. This arrangement guarantees that the CRWDSNKR Index provides a relevant, targeted perspective of the market for high-end sneakers.

The study can use consistent, transaction-based data to analyze sneaker performance by depending on this index. The CRWDSNKR Index was chosen due to its methodological consistency, brand specificity, and relevance to the collectibles category, even though larger resale platforms like StockX and GOAT offer more comprehensive listings. As such, it provides a strong standard by which to measure the investment potential of sneakers in a cross-asset context.

3.3.10 Art

This study's assessment of fine art as a collectible asset class is based on the Art Market Research (AMR) Index, a reputable standard that institutions, appraisers, and investment firms use to evaluate long-term performance across different art market segments. Owing to its methodological transparency, historical depth, and artist-level granularity, the analysis presented here is solely based on AMR data, although other indices, like the Artprice100, were taken into consideration for comparative context.

With a focus on data consistency and repeatability, Art Market Research uses verified auction sale prices from international auction houses to create its indices. The AMR methodology creates indices by monitoring recurring sales of the same artist or type over time, and it divides the market into segments based on period, region, and medium (e.g., prints, paintings, photographs). This strategy reduces distortions brought on by sporadic, big-ticket sales or unexpected spikes in unusual inventory.

The Core ArtistsX dataset was utilized to construct the art market index utilized in this investigation. This subset consists of artists whose works have sold over thirty times in a 24-month period, which guarantees enough liquidity and transaction frequency to produce a strong and trustworthy indication of price trends. The list features artists from the past and present whose presence at auction is noteworthy and steady. Internationally renowned artists like Claude Monet, Jean-Michel Basquiat, Yayoi Kusama, Lucian Freud, Ansel Adams, and Francis Bacon are just a few examples. The index is guaranteed to reflect general market movements rather than peculiar pricing anomalies thanks to this carefully selected list of core artists.

The necessity for coherence and comparability across other collectible categories examined in this study led to the decision to exclusively rely on the Art Market Research data. The methodology used for alternative assets like fine wine, watches, and sneakers is in line with the AMR index's emphasis on regular and transparent transaction data. Furthermore, an accurate longitudinal evaluation of the performance of art as an investment class is made possible by its consistent historical tracking.

All things considered, the art index employed in this study provides a systematic and reliable framework for comparing different assets by reflecting the price performance of actively traded, investment-relevant artworks. The appendix contains the complete list of artists that are part of the Core ArtistsX index.

3.4 Yahoo Finance API

3.4.1 Process

Using Python programming, a thorough data extraction framework was created to support the empirical analysis of this thesis. In order to provide solid foundations for further analytical work, the methodology sought to methodically collect trustworthy time-series financial and economic data from reputable sources.

Yfinance, which offers programmatic access to the Yahoo Finance API for retrieving historical market data, including stock prices, dividends, and market indices, was one of the key Python libraries used in the data collection process. The OS library made file system operations and directory management easier for structured data storage, while the pandas library made efficient data manipulation and analysis possible, especially when working with financial time-series data.

To obtain historical market data for designated ticker symbols over predetermined time periods, the methodology used the yf.download() function. To capture medium-term trends while keeping dataset sizes manageable, data extraction was set up to run at monthly intervals from January 1, 2000, to June 30, 2025. To guarantee compatibility with European analytical tools and standards, all data was processed and saved in CSV format using UTF-8 encoding and semicolon delimiters.

To guarantee consistency throughout the analytical framework, all downloaded datasets underwent consistent processing. In accordance with European standards, price data was formatted with commas in place of decimal points, date formatting was standardized to DD/MM/YYYY, and files were systematically named by combining ticker symbols with asset descriptions. Strong error-handling features like empty dataset detection, exception handling for unsuccessful downloads, and confirmation messages for successful data retrieval were all included in the scripts.

Reproducibility through standardized scripts, scalability for adding new assets or extending time periods, efficiency in lowering manual labor and potential errors, and transparency through explicit documentation of data sources and processing steps are just a few of the methodological benefits that this automated approach offered. While upholding strict criteria for data quality and guaranteeing thorough coverage of pertinent financial markets and instruments, the methodical approach created a strong basis for empirical financial analysis.

3.5 Processing

3.5.1 Calculating and analyzing return on an asset using the Napierian logarithm

The process used to convert unprocessed market data into consistent, comparable financial measures for each of the asset classes being examined is described in this section. Excel was used for data processing, and key financial indicators were calculated using each asset's historical index values. In addition to measures of annualized volatility and compound annual growth rates (CAGR), these include logarithmic returns, excess returns, and base-100 rebased indices. Throughout, the 13-Week U.S. Treasury Bill was used as a stand-in for the risk-free rate.

3.5.1.1 Calculation of logarithmic return

Because of their statistical and analytical benefits, logarithmic returns, also known as "log returns," were used in this investigation. Each asset's log return is determined by taking the natural logarithm of the ratio of its price at time t to its price at time t-1, which is written as follows:

r t = ln P t P t - 1

This transformation allows for more precise aggregation of returns over time and facilitates the application of financial models that assume normally distributed returns.

3.5.1.2 Advantages of logarithmic return

Compared to simple (arithmetic) returns, logarithmic returns have a number of advantages. They are time-additive, which makes it simple to add returns over several time periods to get the total return over a longer time horizon. Second, they offer a more accurate representation of continuous compounding, which is especially helpful for derivative pricing and portfolio theory. Third, when analyzing significant price movements, log returns are more accurate than simple returns. Finally, because of their more advantageous distributional characteristics, they are better suited for econometric modeling and hypothesis testing.

3.5.2 Calculating returns

Using the previously mentioned methodology, the log returns were computed for every asset series. To evaluate each asset's relative risk, the annualized volatility—which is the standard deviation of returns scaled to an annual frequency—was calculated from these returns.

3.5.3 Calculating excess returns

In order to evaluate risk-adjusted performance, excess returns were computed by deducting the periodic return of each asset from the contemporaneous risk-free rate, which was represented by the 13-Week U.S. Treasury Bill. This metric, which forms the basis for other performance indicators like the Sharpe Ratio, represents the extra return an investor would obtain over a risk-free investment.

R excess , t = R t - R f , t

3.5.4 Base - 100 Indexing

We used Base-100 indexing of historical price data to enable meaningful comparisons across a wide range of asset classes, each with its own nominal price scales, currencies, and levels of volatility. Each asset's value series is reindexed using this method, starting the first data point at 100. The following values are computed:

Index t = P t P 0 × 100

This method makes it possible to visually interpret relative price appreciation or depreciation over time across various asset classes in an intuitive manner. Additionally, it offers a stand-in for cumulative total growth, enabling investors to evaluate trajectories without being duped by disparities in absolute pricing or scale.

The Base-100 index represents nominal price-level changes, in contrast to return-based techniques (such as logarithmic or arithmetic returns). It is especially appropriate for illiquid or low-frequency assets (like collectibles), where daily return computations might be inaccurate or not available. The Base-100 index offers a normalized trajectory for each asset's performance over the study period, whereas log returns are utilized for computations of volatility, excess return, and Sharpe ratio.

3.5.5 Risk free rate

A reliable and consistent risk-free rate is necessary to evaluate risk-adjusted performance across asset classes. We used the 13-Week U.S. Treasury Bill (T-Bill) as a stand-in for the risk-free rate for this purpose. Because of its very low default risk, complete support from the US government, and strong liquidity in the financial markets, this instrument is widely recognized in academic finance as the standard benchmark.

The 13-week T-Bill, which matures in about three months, represents the return on short-term government debt. Because of its daily data availability and low duration risk, it is widely used in the literature (for example, in calculations of excess return and Sharpe ratio). Yahoo Finance provided the data, which shows the yield in percentage terms, under the ticker ^IRX.

The quoted annualized yield was converted into a daily return equivalent in order to match the 13-week T-Bill yield to the format of the asset returns used in the analysis. In order to calculate excess returns, which are a prerequisite for figuring out risk-adjusted performance metrics like the Sharpe Ratio, we were able to create a time series of risk-free returns that could be directly subtracted from asset-level returns.

It is crucial to remember that, even though the underlying time series may be less frequent, the risk-free rate is applied to collectibles in the same manner as it is to financial assets. To maintain methodological consistency in those situations, the risk-free rate was combined or compared to the available data points.

By separating the extra return (or risk premium) investors received for taking on more risk than they would have if they had not, this method offers a neutral and generally recognized standard by which to evaluate asset performance.

3.6 Pearson correlation coefficients

The logarithmic returns of each asset were used to calculate Pearson correlation coefficients, which were used to assess the relationships between asset returns across categories. The degree and direction of the linear relationship between two variables are measured by the Pearson correlation coefficient, or r. It accepts values from -1 to +1, where 0 means there is no linear correlation, +1 means there is a perfect positive linear relationship, and -1 means there is a perfect negative linear relationship.

The Data Analysis Toolpak's correlation matrix and Microsoft Excel's built-in CORREL() function, which both apply the conventional Pearson correlation formula, were used to compute correlations in this study:

r = t = 1 n ( x t - x ¯ ) ( y t - y ¯ ) t = 1 n ( x t - x ¯ ) 2 t = 1 n ( y t - y ¯ ) 2

Where:

  • xt and yt are the return values at time t,
  • and ȳ are the mean returns of the respective assets,
  • n is the number of time periods.

This method enables the identification of how closely different asset classes move together over time. The resulting correlation matrix helps determine diversification potential and cross-asset risk interdependencies within the studied portfolio.

A summary interpretation scale is as follows:

Correlation Value Relationship Type Interpretation
+1.00 Perfect positive Returns move exactly together
+0.80 to +0.99 Strong positive Tend to move together
+0.50 to +0.79 Moderate positive Some tendency to move together
+0.20 to +0.49 Weak positive Slight tendency to move together
0.00 No correlation Movement is unrelated
-0.20 to -0.49 Weak negative Slight tendency to move oppositely
-0.50 to -0.79 Moderate negative Some tendency to move in opposite directions
-0.80 to -0.99 Strong negative Tend to move in opposite directions
-1.00 Perfect negative Always move in opposite directions

3.7 First linear regression series

3.7.1 Collectibles & luxury brand stocks

The relationship between collectibles and the stocks of the luxury brand manufacturers that produce them is examined by this set of linear regressions. In each instance, the collectible index is regarded as the dependent variable (Y), and the manufacturer's stock price is the independent variable (X). This methodological decision is in line with the theory that brand-level elements, like financial performance, brand perception, or changes in product strategy, may have an impact on the value or performance of collectible assets.

This analysis's main goal is to assess collectibles' behavior in relation to the company's stock from the perspective of an investor, not to prove strict causation. This method sheds light on whether collectibles move in lockstep with the financial market performance of the brand they are associated with, possibly acting as a hedge, a complement, or a sign of brand strength.

But there are drawbacks to this framing as well. The value of collectibles may occasionally boost the parent brand's reputation and even affect how the market views it, raising the possibility of reverse or bidirectional causality. Collectibles, especially iconic, limited-edition items, have the power to influence consumer engagement and public interest, which may then have an impact on equity performance.

However, the majority of large-cap luxury firms are influenced by institutional investor flows, diversified product lines, and broader economic factors. As a result, collectibles have a negligible direct impact on short-term financial performance, even though they may raise long-term brand prestige.

3.7.2 First linear regression

Using a methodical approach, the regression analysis framework looked at the connections between manufacturer stocks and collectible assets in nine different luxury categories. While acknowledging the inherent constraints imposed by market structure and ownership patterns, each pairing was carefully chosen to represent the most direct corporate-collectible relationships available within the luxury goods ecosystem.

The Liv-ex Champagne 50 Index was the dependent variable in the Champagne segment, while LVMH (Euronext Paris) was the independent variable. With its renowned portfolio that includes Dom Pérignon, Krug, Veuve Clicquot, and Moët & Chandon, LVMH holds a dominant position in the premium champagne market, which is reflected in this relationship. The study estimates that the largest single producer contribution to the Liv-ex Champagne 50 Index is made up of champagnes owned by LVMH, which make up about 38% of the index's composition. By testing the hypothesis that corporate financial success in luxury consumables translates into predictable appreciation patterns for the underlying physical assets, the regression analyzes whether LVMH's equity performance can systematically predict movements in the larger premium champagne collectibles market.

Diageo (LSE: DGE) was used as the independent variable in the Whisky segment, while the Rare Whisky Brora Index was used as the dependent variable. Given Diageo's ownership of the now-closed Brora distillery and authority over the brand's heritage, this pairing turns out to be especially pertinent. Due to consumption and the impossibility of new production after the distillery closed in 1983, rare Brora single malt bottles represent a finite and diminishing supply. The regression examines whether Diageo's corporate performance affects the collectible value of these bottles.

Hermès (Euronext Paris) served as the independent variable for the Handbags category, and LuxPriceIndex values for three different Hermès models—the Birkin, Kelly, and Constance bags—were the dependent variables. Examining the relationship between Hermès' corporate equity performance and secondary market valuations of its most recognizable handbag models—which have become known as both luxury accessories and investment assets—is made possible by this direct manufacturer-product relationship.

Given the variety of ownership structures found in the luxury watch industry, the watches segment needed a more sophisticated strategy. Relationships between the parent company and its watch brands were examined by regressing LVMH (Euronext Paris) against the WatchCharts LVMH Market Index and TAG Heuer Market Index. With its varied portfolio of esteemed manufacturers, Richemont was used as the independent variable against a number of dependent variables, such as the WatchCharts Richemont Market Index and brand-specific sub-indices for Cartier, IWC, Jaeger-LeCoultre, Vacheron Constantin, and Montblanc. In order to capture relationships across various market segments, Swatch Group stock was paired with the WatchCharts Swatch Market Index, Omega Market Index, and Breguet Market Index. Hermès was included with its corresponding WatchCharts Hermès Market Index. Notably, prominent independent brands including Rolex, Patek Philippe, Audemars Piguet, and A. Lange & Söhne were excluded from this regression series due to their private ownership structures.

To capture the fragmented nature of the industry, diamond analysis used a variety of techniques. Richemont, Signet Jewelers Limited (NYSE: SIG), and LVMH (Euronext Paris) were all independent variables in different regressions against the IDEX Diamond Index. The purpose of this multi-company framework is to determine whether the performance of diamond collectibles is correlated with the exposure of companies to luxury jewelry, diamond retail, and diamond trading operations.

Three different manufacturer relationships were included in the analysis of classic cars. In order to analyze the relationships between corporate performance across various vintage categories, Ferrari (NYSE: RACE) was used as the independent variable against three K500 Ferrari indices covering the Pre-1958, 1958–1973, and Post-1973 segments. Porsche Holding SE (PAH3.DE) was regressed against the Pricing Culture Porsche Index and the K500 Porsche Index, offering a variety of viewpoints on parent company relationships using traditional valuations. The Pricing Culture Aston Martin Index and Aston Martin Lagonda (LSE: AML.L) stock were used to analyze the connections between the British automaker's equity performance and the collectible values of vintage cars.

Nike (NYSE: NKE) was used as the independent variable in the Sneakers segment against the CRWDSNKR Index, which consists of limited editions and culturally significant releases of carefully chosen collectible sneaker models. Given Nike's dominance in athletic footwear and cultural influence, this pairing examines whether the company's corporate performance forecasts changes in the collectible sneaker market.

The lack of appropriate publicly traded parent companies created special difficulties for the art industry. Meaningful equity market comparisons are impossible because the artists included in the Art Market Research Index are diverse creators, many of whom are deceased or work independently of publicly traded companies. This structural limitation highlights the fundamental differences in value creation mechanisms across collectible categories and separates art from other collectible categories that maintain direct corporate relationships, thereby requiring its exclusion from the manufacturer-collectible regression analysis.

3.7.3 Alpha (α) & p-value and regression hypothesis testing

The p-value is used in linear regression to assess the statistical significance of the model's coefficients, especially the slope (β) and intercept (α). It examines the null hypothesis, which states that there is no linear relationship between the independent variable (X) and the dependent variable (Y), when a given coefficient equals zero.

The null hypothesis (H₀) is rejected at the 5% significance level if the p-value is less than 0.05, indicating that the coefficient is statistically significant. This suggests that there is a significant relationship between the independent and dependent variables. On the other hand, we are unable to reject H₀ if the p-value is ≥ 0.05, indicating that the sample data does not show any statistically significant evidence of a relationship.

It is crucial to stress that a high p-value does not always indicate that a relationship does not exist. Instead, a small sample size, high variance, or a small effect size could indicate limited statistical power. P-values less than 0.05 were considered statistically significant relationships in this study.

To make the interpretation process more efficient, a decision rule was added to Excel. The null hypothesis is rejected, indicating statistical significance, if p < 0.05. The null hypothesis is not rejected if p ≥ 0.05, indicating that there is no statistical support for a relationship.

The p-value, sign, and magnitude of β were then combined to determine the final conclusion for each regression. A significant positive β, for instance, indicates a positive linear relationship. A negative linear relationship is indicated by a significant negative β. Regardless of the value of β, a non-significant p-value indicates that there is "no statistically significant relationship."

Beta (β)

The beta coefficient (β) quantifies the expected change in the dependent variable (Y) for every unit increase in the independent variable (X). The magnitude of β represents the strength of the relationship, whereas its sign (positive or negative) indicates its direction.

A weaker relationship is implied if |β| < 1, meaning that a change in X results in a proportionately smaller change in Y. When Y changes more than proportionately in response to changes in X, the relationship is amplified if |β| > 1. X and Y have a one-to-one relationship if |β| = 1.

An inverse relationship is indicated by a negative β. For example, β = -0.5 indicates that a one-unit increase in X results in a 0.5-unit drop in Y. A stronger inverse effect, where every unit increase in X causes a two-unit drop in Y, is implied by β = -2. This interpretation aids in determining whether and in which direction shifts in collectible performance are linked to brand equity.

3.8 Second linear regression series

3.8.1 Collectibles & Stock markets indexes and commodities and digital assets

We investigate the connection between collectible asset performance and more general financial market indicators, such as stock indices, commodities, and digital assets, in the second linear regression series. The MSCI World Index, the S&P Global Luxury Index Total Return (TR), COMEX Gold Futures, and Bitcoin are the independent variables (X) in this study. The purpose of these regressions is to determine whether trends in speculative digital assets, changes in commodity prices, or global equity performance are correlated with collectibles behavior.

The S&P Global Luxury Index TR concentrates more specifically on the publicly traded luxury goods industry, whereas the MSCI World Index acts as a stand-in for the behavior of the global stock market. The commodity component is represented by COMEX Gold Futures (ticker GC=F), which provides information about the safe-haven or hedging qualities of collectibles. The performance of alternative assets and high-risk, high-volatility investment behavior are benchmarked against Bitcoin.

A set of dependent variables (Y), which correspond to the collectible return series indexes, is regressed against the independent variable (X) for each regression.

All computations were based on excess log returns, just like in the first regression series. Standard econometric functions in Excel were used to calculate alpha (α), beta (β), R², standard error, t-statistic, degrees of freedom, and p-value for each X–Y pair. This made it possible to test linear relationships across all collectible classes and market variables using a consistent and repeatable statistical framework.

3.9 Risk (volatility) - standard deviation (σ)

The standard deviation of each asset's logarithmic returns is used in this study to evaluate the risk attached to it. In financial analysis, the standard deviation (σ) is a commonly used statistical indicator of volatility. It provides a quantitative estimate of the uncertainty or dispersion in asset performance by capturing the degree to which individual returns differ from the mean return.

To guarantee uniformity and comparability across time periods and asset classes, monthly log returns were first computed for every asset. The monthly standard deviation was calculated using these monthly returns. This measure provides a clear picture of how stable—or volatile—an asset tends to be in the short term by reflecting the average variability in monthly performance.

To translate this monthly volatility into an annualized figure, the standard deviation was scaled by the square root of 12, consistent with standard financial methodology:

σ annual = σ monthly × 12

Regardless of the asset classes' liquidity, pricing frequency, or market dynamics, this method enables a consistent comparison of volatility across all of them. While a lower value denotes more steady and predictable returns, a higher standard deviation denotes more volatility and, consequently, a higher degree of investment risk.

This metric is essential for assessing return-to-risk trade-offs, which are further examined using the Sharpe Ratio in the section that follows, as well as for comprehending standalone risk.

3.10 Return/risk - Sharpe ratio (S)

One important financial metric for evaluating an asset or portfolio's risk-adjusted return is the Sharpe Ratio. It calculates the excess return over the risk-free rate in relation to the level of risk (volatility) assumed. This offers a consistent method for evaluating the performance of investments with varying degrees of risk.

The Sharpe Ratio was computed in this study using monthly logarithmic excess returns, which are the monthly log returns of each asset less the monthly risk-free rate, which in this case is the 13-week Treasury Bill issued by the United States.

Calculation steps:

  1. Average Monthly Excess Return (ER): The arithmetic mean of the monthly excess returns.
  2. Monthly Volatility (σ): The standard deviation of the monthly log returns (not excess returns), used to reflect total risk.
  3. Monthly Sharpe Ratio:
    S = Rp Rf σp
    Where:
    • Rp = average monthly return of the asset
    • Rf = monthly risk-free rate
    • σp = standard deviation of log returns
    S monthly = Rp Rf σp
  4. Annualized Sharpe Ratio:
    S annual = S monthly × 12

The monthly Sharpe is multiplied by the square root of 12 to account for annualization, under the assumption that monthly returns are independently and identically distributed which is standard practice in financial modeling.

3.11 Methodological considerations and limitations

Certain assumptions may not hold consistently across all asset classes examined, especially in alternative and illiquid markets, even though this methodology makes use of widely recognized financial and econometric techniques. While return-based models assume reasonably continuous and normally distributed price data, linear regressions assume a stable and linear relationship between variables. In practice, collectible markets frequently display distinct valuation mechanisms, sparse data points, and non-linear dynamics. Comparability across asset classes may also be impacted by variations in data frequency, liquidity, and pricing transparency. Although the analysis is not invalidated by these limitations, they do advise caution when interpreting the results too strictly. The Limitations chapter provides a more thorough explanation of these restrictions.

Chapter 4: Analysis

4.1 Market paths: collectibles -- manufacturer' stocks -- broader market indexes

4.1.1 Champagne

A seven-year, eight-month study of the champagne market, conducted between June 2015 and January 2023, offered insights into this luxury consumable collectibles market segment that combines investment potential with the distinctive quality of being a wasting asset. High-net-worth individuals' growing interest in alternative investments and a period of unprecedented monetary expansion are captured by this extended timeframe.

During this time, the performance of alternative assets and market benchmarks varied. The MSCI World Index showed steady performance with moderate volatility of 16.00%, achieving strong returns of 60.46% with a compound annual growth rate (CAGR) of 6.36% and a Sharpe ratio of 0.323. Given the luxury sector's sensitivity to cycles in discretionary spending, the S&P Global Luxury Index performed better, yielding a total return of 101.16% (9.54% CAGR) and a Sharpe ratio of 0.352, despite having higher volatility of 23.20%. With a lower Sharpe ratio of 0.116, volatility of 14.06%, and more modest gains of 22.68% (2.70% CAGR), gold futures showed the precious metal's long-standing function as a store of value during this time. Bitcoin achieved exceptional returns of 8,695.86% (79.31% CAGR) with a strong Sharpe ratio of 0.774, despite extreme volatility of 74.89%, highlighting the emergence of digital assets as a new investment category.

With a remarkable 477.98% total return (25.71% CAGR) and an exceptional Sharpe ratio of 0.984 with volatility of 22.44%, LVMH stock showed remarkable performance. This impressive performance demonstrates LVMH's leadership in a number of luxury markets, including its esteemed champagne portfolio, which includes Dom Pérignon, Krug, Veuve Clicquot, and Moët & Chandon. The company's superior risk-adjusted returns during this period were a result of its ability to maintain pricing power and capture premiums in the luxury market across economic cycles.

With a total return of 126.36% (11.24% CAGR) and an outstanding Sharpe ratio of 1.929—the highest of all the collectibles categories examined in this study—the Liv-ex Champagne 50 index produced outstanding performance. Champagne showed excellent risk-adjusted returns with a remarkably low volatility of just 5.04%, fusing remarkable stability with significant appreciation. From a pure risk-return standpoint, this performance profile makes champagne one of the most alluring collectible investments, providing investors with exposure to trends in luxury consumption while preserving capital preservation qualities.

The success of the champagne market is due to a number of essential elements that set it apart from other collectible categories. Strict appellation contrôlée laws guarantee quality standards and avoid market saturation, while limited production from particular terroirs naturally creates supply constraints. The consumable nature of champagne creates natural scarcity over time, as bottles consumed reduce the available supply of vintage wines, particularly for exceptional years. Growing demand for high-end champagne around the world, fueled by the creation of wealth in emerging markets and cultural trends toward opulent experiences, has continuously supported price growth.

Champagne is among the most convincing examples of risk-adjusted efficiency in the collectibles industry when viewed through the lens of risk-volatility. The performance characteristics seen in luxury handbags are mirrored by the Sharpe ratio of 1.929 and volatility of only 5.04%, which show steady and comparatively high returns with closely clustered monthly performance variations. This low volatility environment implies that, in contrast to other collectibles categories like art, watches, or vintage cars, the price of champagne stayed comparatively steady while steadily rising. The market's maturity, well-established auction procedures, open pricing via the Liv-ex platform, and champagne's dual status as a luxury good and a collectible asset are probably the reasons for the remarkable stability.

When backed by strong market infrastructure and real scarcity dynamics, luxury consumables can operate as sophisticated investment vehicles, as demonstrated by the champagne market, which stands out as one of the most successful collectibles investments during the studied period. With the highest Sharpe ratio among all collectibles categories and exceptionally low volatility, the Liv-ex Champagne 50 produced outstanding risk-adjusted returns that outperformed the majority of conventional asset classes. While this performance did not match LVMH's equity returns in absolute terms, champagne provided superior risk-adjusted gains that significantly exceeded conventional investment alternatives. The market's success is a reflection of the distinctive investment qualities of luxury consumables, which include a strong brand heritage spanning centuries, limited production capacity limited by terroir, natural scarcity through consumption, and rising global luxury consumption among affluent demographics. Champagne showed strong investment merit during this period for investors looking for collectibles exposure with less volatility and steady appreciation; however, investors should also take into account the asset's consumable nature, storage needs, and authentication issues when making their investment decisions.

4.1.2 Whisky

From July 2015 to June 2025, the whisky market was examined for ten years and zero months. This gave researchers a thorough ten-year view of this collectible spirits market, with a particular emphasis on the rare and highly sought-after Brora single malt Scotch whisky. This longer time period covers several economic cycles, such as the effects of the COVID-19 pandemic, changes in monetary policy, and changing collector preferences. It provides strong insights into the long-term investment characteristics of rare spirits as alternative assets.

During this ten-year period, the alternative assets and market benchmarks showed impressive performance. The global equity markets' resilience in the face of sporadic volatility is demonstrated by the MSCI World Index, which produced strong returns of 128.05% with a CAGR of 8.59% and a Sharpe ratio of 0.425. It also showed steady performance with moderate volatility of 15.15 percent. With a 131.20% total return (8.74% CAGR) and a Sharpe ratio of 0.289, the S&P Global Luxury Index performed well, despite having a higher volatility of 22.69%. This suggests that the luxury sector is sensitive to changes in the economy and patterns of discretionary spending. With a strong Sharpe ratio of 0.459 and volatility of 14.36%, gold futures reported strong gains of 148.48% (9.53% CAGR), confirming the precious metal's function as a store of value and inflation hedge during monetary expansion. Bitcoin demonstrated the remarkable rise of digital assets as a new investment paradigm by achieving remarkable returns of 37,537.57% (80.95% CAGR) with a strong Sharpe ratio of 0.845, despite extreme volatility of 68.81%.

With a total return of 86.26% (6.42% CAGR), Diageo's stock demonstrated a modest performance. However, it produced a negative Sharpe ratio of -0.105, indicating poor risk-adjusted returns in spite of positive absolute performance. The stock's 17.41% moderate volatility was a reflection of the difficulties big spirits companies have in matching the high prices that rare collectible whiskies fetch. The gap between corporate performance and the appreciation of collectible assets is highlighted by Diageo, one of the biggest spirits companies in the world with a diverse portfolio that includes Scotch whisky brands like Johnnie Walker, Lagavulin, and ownership of the now-closed Brora distillery. Despite having a wide exposure to the spirits market, Diageo was unable to capitalize on the extraordinary returns found in rare whisky collectibles.

With an impressive total return of 494.82% (19.52% CAGR) and a strong Sharpe ratio of 0.310, the RWB-Rare Whisky Brora index showed outstanding performance. In absolute terms, Brora whisky outperformed all conventional benchmarks and the majority of other collectibles categories, with a moderate volatility of 18.47%. This made rare whisky one of the most profitable alternative investments of this decade. The remarkable premium that investors and collectors place on provenance, cult status, and absolute scarcity within the whisky collecting community is reflected in the nearly 500% appreciation. The notable premium linked to scarcity, heritage, and collector demand in the luxury spirits market is highlighted by the rare Brora whisky's spectacular outperformance over Diageo's stock performance. Since distillery closures create absolute supply constraints, natural consumption gradually reduces available inventory, whisky's cultural significance and collector enthusiasm, and its emergence as a recognized alternative asset class among sophisticated investors, this disconnect shows that collectible whisky markets function according to fundamentally different valuation mechanisms than their producing companies.

According to a risk-volatility analysis, the Rare Whisky Brora index has a Sharpe ratio of 0.310 and volatility of 18.47%, which indicates a moderate level of risk accompanied by significant absolute returns but not particularly good risk-adjusted performance. Whisky maintains a positive Sharpe ratio, indicating sufficient compensation for the inherent volatility in collectibles markets, in contrast to art, which exhibits negative risk-adjusted returns. Because whisky investment markets are still in their infancy, rare bottles have limited liquidity, and price discovery is difficult in a market that relies on auction results and private sales, the volatility is comparatively high when compared to champagne or luxury handbags. While offering comparable absolute returns, rare whisky's volatility is still much lower than that of digital assets, making it an alluring compromise between conventional investments and highly speculative alternatives.

During the examined decade, the rare whisky market—best represented by Brora single malt—became one of the most lucrative collectibles investments, confirming the idea that rare spirits make alternative assets. While maintaining a positive risk-adjusted return profile, the RWB-Rare Whisky Brora index produced remarkable absolute returns of almost 500%, significantly outperforming conventional asset classes and the majority of other collectibles categories. Given the significant absolute gains and the inherent difficulties of investing in physical collectibles, the moderate Sharpe ratio of 0.310—while not exceptional—remains alluring with a 18,47% volatility. The success of Brora whisky is a result of a number of important investment factors, including the distillery's closure in 1983, natural consumption that reduced supply, the brand's strong heritage and cult following among collectors, and the growing interest in rare spirits among high-net-worth individuals worldwide as alternative investments. Rare discontinued whiskies like Brora showed compelling long-term appreciation potential for investors and collectors willing to endure moderate volatility, illiquidity constraints, and the challenges of authentication and storage. However, such investments necessitate specialized knowledge of market dynamics, provenance verification, and the best storage conditions unique to the spirits category.

4.1.3 Watches

From January 2021 to June 2025, the luxury watch market was examined for four years and six months, offering insights into this upscale collectibles market that includes both independent, prestigious manufacturers and publicly traded conglomerates. The post-COVID luxury boom, the ensuing market correction, and changing collector preferences across various ownership structures within the watch industry are just a few of the significant market dynamics that are captured in this timeframe.

During this time, the performance of alternative assets and market benchmarks varied. The MSCI World Index showed steady performance with moderate volatility of 15.00%, achieving strong returns of 51.27% with a compound annual growth rate (CAGR) of 9.63% and a strong Sharpe ratio of 0.386. With a 12.34% total return (2.62% CAGR) and a low Sharpe ratio of 0.023, the S&P Global Luxury Index performed more modestly, despite having higher volatility of 22.09%. This reflects the luxury sector's sensitivity to cycles in discretionary spending and economic uncertainty. With an outstanding Sharpe ratio of 0.808 and volatility of 14.47%, gold futures reported robust gains of 89.35% (15.24% CAGR), highlighting the precious metal's function as an inflation hedge during this time. Despite significant volatility of 60.79%, Bitcoin produced remarkable returns of 223.53% (29.81% CAGR) with a strong Sharpe ratio of 0.425, underscoring the ongoing rise of digital assets as alternative investments.

4.1.3.1 Watches with Public Available Company Stock

There was a clear discrepancy between the equity performance of the publicly traded luxury conglomerates and the collectible market valuations of their watch businesses. With a Sharpe ratio of -0.108 and volatility of 21.09%, LVMH's stock experienced a slight decline of -2.47% during that time, but its watch portfolio displayed noticeably more severe weakness. Despite controlled price fluctuations, the WatchCharts LVMH Market Index showed poor risk-adjusted performance, with a concerning Sharpe ratio of -2.241 and volatility of 2.85%, resulting in a significantly worse performance of -15.99%. The difficulties this sports luxury brand faced in preserving resale value during the market correction were reflected in the WatchCharts TAG Heuer Market Index, which fell -11.82% with a negative Sharpe ratio of -1.158 and 5.40% volatility.

With a strong Sharpe ratio of 0.382, volatility of 31.69%, and an outstanding 92.05% appreciation, Richemont's stock saw a sharp divergence from the resale performance of its watch brands. With a negative Sharpe ratio of -1.080 and 3.52% volatility, the WatchCharts Richemont Market Index fell by -5.22%. While the WatchCharts IWC Market Index experienced more severe losses of -17.26% with a Sharpe ratio of -2.234 and 3.26% volatility, the WatchCharts Cartier Market Index saw a decline of -7.28% with a Sharpe ratio of -1.158 and 3.59% volatility. Despite a slight increase of 1.78%, the WatchCharts Jaeger-LeCoultre Market Index remained volatile at 2.81% and had a negative Sharpe ratio of -0.821. The WatchCharts Vacheron Constantin Market Index performed comparatively better, rising 8.61% despite maintaining a negative Sharpe ratio of -0.164 and higher volatility of 8.19%. With a volatility of 3.64% and a Sharpe ratio of -0.707, the WatchCharts Montblanc Market Index showed slight gains of 2.84%.

With a sharply negative Sharpe ratio of -0.943, volatility of 27.15%, and a severe equity decline of -43.26%, Swatch Group saw a similar downward trajectory for its watch brands. With a volatility of 3.54% and a Sharpe ratio of -0.880, the WatchCharts Swatch Group Market Index returned -1.20%. Despite modest gains of 0.65%, the WatchCharts Omega Market Index had a negative Sharpe ratio of -0.613 and volatility of 4.39%. The WatchCharts Breguet Market Index was the most worrisome, declining sharply at -9.69% and having the lowest Sharpe ratio of all the brands examined at -2.535 and 2.25% volatility.

A remarkable 178.45% return was achieved by Hermès stock, which also showed an excellent Sharpe ratio of 0.642 and moderate volatility of 22.09%. But with a negative Sharpe ratio of -0.921 and 8.39% volatility, the WatchCharts Hermès Market Index fell -18.53%, underscoring once more the stark discrepancy between the stock performance of luxury companies and the resale value of their watches.

4.1.3.2 Watches with No Public Available Company Stock

Private ownership structures may offer better protection against market volatility and corporate governance pressures, as evidenced by the significantly better performance of independent luxury watchmakers when compared to their publicly-listed counterparts. The brand's standing as a reliable producer of investment-grade timepieces was strengthened by the WatchCharts Patek Philippe Market Index, which produced impressive returns of 21.65% with a positive Sharpe ratio of 0.162 and volatility of 11.83%. With 26.19% returns and a Sharpe ratio of 0.277 with 10.67% volatility, the WatchCharts Audemars Piguet Market Index outperformed the others in this category. This indicates that the brand's positioning in the ultra-luxury market is validated and that risk-adjusted gains are effective.

Although the WatchCharts A. Lange & Söhne Market Index showed strong returns of 14.51%, its 3.71% volatility and slightly negative Sharpe ratio of -0.044 indicate limited risk efficiency. Even the most prestigious and liquid watch brands were not immune to market correction during this time, as evidenced by the WatchCharts Rolex Market Index, which posted negative returns of -2.19% with a Sharpe ratio of -0.400 and 7.49% volatility, despite the brand's global market dominance and widespread recognition. The normalization of previously inflated secondary market prices that had reached unsustainable levels during the pandemic-era speculation boom is probably the cause of this underperformance.

Over the course of the analysis, the luxury watch market showed a highly polarized performance, with notable differences between privately held companies and publicly traded conglomerates. The majority of publicly-affiliated brands saw poor or stagnant performance, but a few independent brands, including Audemars Piguet, Patek Philippe, and A. Lange & Söhne, produced respectable results with positive risk-adjusted returns. Brand heritage, production control, and collector sentiment frequently outweigh corporate financial metrics in the complex asset class of luxury watches, as evidenced by the persistent discrepancy between stock performance and resale values. The superior performance of independent manufacturers raises the possibility that private ownership arrangements could better balance long-term collectible value preservation with brand stewardship, providing valuable information for investors and collectors looking to gain exposure to horological assets as alternative investments.

4.1.4 Handbags

From June 2015 to January 2021, the handbag market was examined for five years and eight months, offering a thorough understanding of this upscale collectibles market that has developed from fashion accessories to sophisticated investment vehicles. The market dynamics during this time period are reflected in the growing awareness of luxury handbags as alternative assets, the increased transparency brought about by specialized indices, and the growing interest of high-net-worth collectors looking to diversify their investments beyond more conventional avenues.

Alternative assets and market benchmarks performed well during this time. The MSCI World Index showed steady performance with moderate volatility of 15.11%, achieving strong returns of 53.36% with a CAGR of 7.84% and a Sharpe ratio of 0.406. With a strong 108.89% total return (13.68% CAGR) and a strong Sharpe ratio of 0.527, despite higher volatility of 22.64%, the S&P Global Luxury Index TR significantly outperformed. This suggests that luxury stocks as a category showed exceptional performance during this period, reflecting strong consumer demand for luxury goods. Bitcoin was the period's most notable performer, with an incredible 12,487.66% total return (134.74% CAGR) and a Sharpe ratio of 1.189, despite extreme volatility of 72.33%. COMEX Gold Futures posted modest gains of 24.41% (3.93% CAGR) with a Sharpe ratio of 0.281 and volatility of 14.15%.

One of the top-performing luxury stocks during this time was Hermès, which showed remarkable performance with a total return of 164.63% (18.74% CAGR), an outstanding Sharpe ratio of 0.771, and moderate volatility of 19.61%. Hermès's outstanding pricing power, dominant position in the ultra-luxury market, and capacity to preserve exclusivity while growing its global presence are all reflected in this impressive performance. The brand's waiting list system for iconic bags, limited distribution strategy, and vertically integrated production model all helped to maintain demand pressure and consistently outperform financially.

Luxurious handbags as alternative assets have sophisticated investment qualities, as evidenced by the impressive but inconsistent results of the handbag indices linked to Hermès. Strong risk-adjusted performance for this most iconic handbag model was demonstrated by the LuxPriceIndex Hermès Birkin, which recorded a total return of 56.01% (8.16% CAGR) with an outstanding Sharpe ratio of 1.581 and remarkably low volatility of 4.31%. With an exceptional Sharpe ratio of 2.005 and controlled volatility of 8.22%, the LuxPriceIndex Hermès Kelly demonstrated its exceptional efficiency as an investment vehicle and the highest risk-adjusted returns of any handbag category examined. Its overall return of 166.67% (18.90% CAGR) was even better. With the lowest volatility of any handbag index at just 3.69% and a healthy Sharpe ratio of 1.723, the LuxPriceIndex Hermès Constance reported more cautious but still appealing gains of 52.67% (7.75% CAGR).

Several key elements that set luxury handbags apart from other collectible categories are responsible for the handbag market's success during this time. Because of Hermès's renowned craftsmanship and legacy, each bag requires a significant amount of artisanal skill and time, which naturally ensures quality and scarcity. Natural supply constraints created by the brand's intentional production limitations and allocation system sustain price growth. The creation of wealth in emerging markets and the growing awareness of handbags as investment assets and status symbols have contributed to the steady increase in demand for ultra-luxury goods worldwide. In contrast to many other collectible categories, the emergence of transparent secondary markets through auction houses and specialized platforms allowed for improved price discovery and liquidity.

The handbag category ranks among the most alluring collectibles investments examined due to its remarkable risk-adjusted performance characteristics. The three Hermès handbag indices all showed exceptionally low volatility and robust returns, resulting in Sharpe ratios that far outperform the majority of conventional financial instruments. With a strong Sharpe ratio of 1.723 and the lowest volatility of 3.69%, the Hermès Constance showed remarkably steady price growth with few monthly swings. Even the best-performing handbag model maintained manageable risk characteristics, as evidenced by the Hermès Kelly's 2.005 Sharpe ratio and 8.22% volatility. The constant pattern of steady, effective returns across all examined models is confirmed by the Hermès Birkin's 1.581 Sharpe ratio and 4.31% volatility. This remarkable stability probably stems from the luxury handbag market's maturity, well-established authentication procedures, clear pricing through reliable auction houses, and the fact that these items are both collectible assets and luxury accessories.

During the 2015–2021 period, the handbag market—especially Hermès products—performed exceptionally well, with all examined indices producing positive returns and remarkable Sharpe ratios that outperformed the majority of conventional asset classes. Out of all the collectibles categories this study looked at, the Hermès Kelly was the best performer with the highest risk-adjusted returns. The Hermès Constance and Birkin models were next in line. Luxury handbags could be useful diversification tools for portfolios looking for alternative asset exposure, as the handbag indices demonstrated superior risk-adjusted performance with significantly lower volatility, even though Hermès stock outperformed in absolute terms. All Hermès handbag models have consistently performed well, and their remarkably low volatility makes this market one of the most alluring alternative investment classes at the moment. It gives investors access to the dynamics of the luxury market while preserving capital preservation traits connected to more cautious investments.

4.1.5 Diamonds

The diamond market was studied for a full decade from June 2015 to June 2025, offering insights into this traditional store of value that has faced significant disruption from laboratory-grown alternatives and changing consumer preferences. This timeframe captures both the mature natural diamond market and the rapid growth of synthetic alternatives that fundamentally altered market dynamics.

Signet Jewelers, as the world's largest retailer of diamond jewelry, showed weak performance with a total return of -23.43% (-2.62% CAGR) and a negative Sharpe ratio of -0.187 with high volatility of 32.06%. This poor performance reflects the structural challenges facing traditional diamond retailers, including competition from online channels, changing consumer preferences favoring experiences over material goods, and the growing acceptance of laboratory-grown diamonds.

The Zimnisky Global Rough Diamond Price Index produced a modest total return of 7.50% (0.73% CAGR) with a low Sharpe ratio of 0.047 and moderate volatility of 5.39%. This weak performance reflects oversupply issues in the rough diamond market, reduced demand from polished diamond manufacturers, and the structural shift towards laboratory-grown alternatives. The IDEX DIAMOND INDEX performed even worse, with a negative total return of -10.19% (-1.07% CAGR) and a negative Sharpe ratio of -0.157, highlighting the challenges facing the polished diamond market.

The diamond market emerged as one of the weakest performing collectible categories during the studied decade, facing structural headwinds that fundamentally challenged its traditional investment thesis. Both natural diamond indices produced negative or minimal returns, with the IDEX DIAMOND INDEX showing a decade-long decline of over 10%. This poor performance reflects not temporary market conditions but rather fundamental disruption from laboratory-grown alternatives that have permanently altered the supply-demand dynamics of what was once considered a reliable store of value.

4.1.6 Classic Cars

From June 2015 to June 2025, the classic car market was examined for ten years, covering this distinctive physical collectibles market where investment value combines with automotive heritage, emotional appeal, and functional utility. The booming collector car market, the ensuing correction, and the continuous changes in generational collecting preferences are all captured in this extensive timeframe.

One of the luxury market's biggest surprises, Ferrari N.V. stock produced an outstanding total return of 615.31% (21.74% CAGR) with a respectable Sharpe ratio of 0.429 and moderate volatility of 30.70%. Due to its successful transformation from an automaker to a luxury brand ecosystem, limited production strategy, and expansion into new markets while preserving exclusivity, Ferrari's stock significantly outperformed its classic car indices.

The collectible Ferrari market showed mixed results across different eras. The K500 Ferrari (Post 1973) index delivered a solid total return of 166.81% (10.31% CAGR) with a Sharpe ratio of 0.238 and moderate volatility of 13.92%. The K500 Ferrari (1958-1973) index produced a more modest return of 85.43% (6.37% CAGR) with a Sharpe ratio of 0.201. The K500 Ferrari (Pre 1958) index lagged with only 42.89% total return (3.63% CAGR) and a Sharpe ratio of 0.167, suggesting that ultra-rare pre-war Ferraris may have reached price ceilings.

Aston Martin Lagonda Global Holdings demonstrated the risks inherent in luxury automotive investments, with a catastrophic decline of -91.80% (-29.49% CAGR) following its October 2018 IPO. The Aston Martin classic car indices also struggled, with the K500 Aston Martin Vantage index showing -8.05% total return and the K500 Aston Martin DB4 index declining -16.62%, both producing near-zero Sharpe ratios despite extremely high volatility exceeding 50%.

Contrasting with the mixed Ferrari and poor Aston Martin performance, the K500 Porsche index emerged as a strong performer with a total return of 155.42% (16.96% CAGR) and an impressive Sharpe ratio of 0.279 with relatively low volatility of 10.24%. This suggests that classic Porsche models, particularly air-cooled 911s, found a sweet spot between accessibility and collectibility.

The classic car market demonstrated the importance of brand selection and era specification in collectible automotive investments. While Ferrari corporate stock dramatically outperformed its collectible vehicles, the opposite held true for Aston Martin, where both equity and physical assets destroyed value. Porsche emerged as the most consistent performer, offering the best risk-adjusted returns among classic car indices.

4.1.7 Sneakers

The sneaker market was analyzed for ten years from June 2015 to June 2025, providing comprehensive insights into this relatively new alternative asset class that has evolved from streetwear culture into a sophisticated secondary market with institutional infrastructure. This timeframe captures the sneaker market's transformation from niche collecting to mainstream investment consideration.

Nike Inc. stock delivered strong performance with a total return of 96.82% (7.01% CAGR) and a Sharpe ratio of 0.153 with volatility of 26.91%. While Nike's equity performance was solid, it significantly lagged the appreciation of its most coveted sneaker models in the secondary market, highlighting the disconnect between corporate performance and collectible value in this category.

The StockX Nike index produced a total return of 161.27% (10.08% CAGR), outperforming Nike's equity. However, this came with extreme volatility of 77.65%, resulting in a low Sharpe ratio of 0.067. The high volatility reflects the speculative nature of the sneaker resale market, rapid shifts in cultural trends, and the influence of celebrity endorsements and limited release strategies on pricing.

The sneaker market's performance demonstrated several unique characteristics. Unlike traditional collectibles where age typically enhances value, sneaker values peaked shortly after release before declining, except for truly iconic models. The market showed extreme sensitivity to cultural moments, with values spiking around celebrity wear, retro releases, and collaborative drops. Authentication emerged as a critical factor, with platforms like StockX and GOAT providing the infrastructure necessary for market maturation.

The sneaker resale market established itself as a legitimate alternative asset class during the studied decade, though with characteristics distinct from traditional collectibles. The StockX Nike index's 161% return demonstrated substantial appreciation potential, but the extreme volatility of nearly 78% made it unsuitable for risk-averse investors. The market's evolution from underground culture to mainstream investment vehicle represents one of the most significant developments in alternative assets during the 2015-2025 period.

4.1.8 Art

From January 2015 to January 2025, the art market was studied for ten years, offering insights into the most established and historically significant collectibles market. The period of extraordinary monetary expansion, the rise of digital art and NFTs, the pandemic's effects on gallery and auction operations, and the rising influence of Asian collectors on the global art market are all captured in this decade-long analysis.

Sotheby's, one of the world's premier auction houses, showed relatively modest performance as a publicly-traded company with a total return of 51.92% (4.26% CAGR) before its privatization in 2019. The company's equity performance significantly lagged the appreciation of the artworks it sold, highlighting the operational challenges and fee pressure facing traditional auction houses despite booming art markets.

The Artprice100 index, tracking the top 100 artists by auction revenue, delivered a disappointing total return of just 11.23% (1.07% CAGR) with a near-zero Sharpe ratio of 0.009 and moderate volatility of 11.51%. This weak performance suggests that even blue-chip artists struggled to generate meaningful returns when viewed as a broad basket, with individual star performers offset by weaker segments of the market.

The art market's decade-long performance revealed several important dynamics. First, the headline-grabbing record sales of individual masterpieces masked weak broader market performance. Second, the concentration of returns in a tiny percentage of artists and works made diversified art investing challenging. Third, the operational costs of art investment—insurance, storage, conservation, and transaction fees—significantly eroded net returns.

Despite its cultural significance and established market infrastructure, art emerged as one of the weakest performing collectible categories during the 2015-2025 decade. The Artprice100 index's mere 11% total return over ten years failed to keep pace with inflation, while high transaction costs and operational complexity further diminished net returns. The art market's performance suggests that its value may lie more in cultural capital and personal enjoyment than pure financial returns.

4.2 Correlation analysis: test H1 & H3

A thorough correlation analysis of two basic theories regarding collectible market behavior is presented in this section. In order to test Hypothesis 1, which suggests that markets for collectibles are positively correlated with their manufacturer stocks, and Hypothesis 3, which investigates whether collectibles are correlated with specific stock market indices, gold, and digital assets, Pearson correlation coefficients are used.

The correlation framework offers crucial information about the market independence and diversification potential of luxury collectibles as alternative investments. We compute correlation coefficients between each collectible category and four key benchmarks using monthly logarithmic returns over the study period: the MSCI World Index, which represents global equity markets; the S&P Global Luxury Index Total Return, which captures the dynamics of the luxury sector; COMEX Gold Futures, which represents traditional safe-haven assets; and Bitcoin, which represents digital alternative assets.

We look at direct correlations between collectible indices and their matching producer stocks for manufacturer relationships. Examples of these include Ferrari versus classic car indices, Diageo versus rare whisky, LVMH versus champagne performance, and other luxury conglomerate-collectible pairings. The basic questions of whether collectibles function as independent value stores or as stand-ins for their manufacturing companies are addressed in this analysis.

4.2.1 H1: collectibles markets are positively correlated to their manufacturer stocks & H3 are correlated to selected stock market indices, gold, and digital assets

Finding the relationships and interdependent dynamics between different collectible indexes and associated luxury brand producers is made easier with the help of the correlation matrix. As shown in the correlation classification table, the correlation coefficient (r) quantifies the direction and strength of these linear relationships, ranging from -1 to +1.

4.2.1.1 Champagne

The statistical relationship between Champagne as a collectible investment, as measured by the Liv-ex Champagne 50 Index, and the larger financial markets as well as its related corporate equity (LVMH) is examined in this section. The objective is to determine whether Champagne provides decorrelated return behavior that is appropriate for diversifying a portfolio, especially when compared to commodities, stocks, and cryptocurrency assets. The Liv-ex Champagne 50 Index has a consistently low correlation with conventional financial benchmarks. There is no discernible correlation between champagne and the world's stock markets (0.063 with MSCI World), precious metals (0.031 with Gold Futures), or cryptocurrencies (0.006 with Bitcoin). These findings support Champagne's independence from financial assets that are influenced by sentiment or cycles.

A weak negative correlation (-0.245) with the S&P Global Luxury Index is the only significant relationship, indicating that the performance of listed luxury goods companies may differ slightly from Champagne prices. The fact that champagne is a consumable and collectible good, where scarcity, connoisseur demand, and vintage quality—rather than public equity market valuations—drive pricing, may be the cause of this.

With a modest correlation of 0.140, there is no discernible relationship between LVMH stock and the Champagne Index. Champagne prices on the secondary market are not greatly impacted by LVMH's stock movements, even though the company is a major producer of Champagne brands (Dom Pérignon, Moët & Chandon, and Krug). The distinct pricing dynamics of collectible consumables in contrast to their commercial parent companies are highlighted by this decoupling.

One notable example of a non-correlated alternative asset is champagne. Its independence from corporate equity performance, commodities, equities, and crypto-assets makes it a useful part of portfolio diversification, particularly in settings looking for protection from macroeconomic volatility. Champagne's slow-moving price dynamics, inherent scarcity, and collector-driven demand make it appealing to investors who are concerned with capital preservation and low-beta exposure. It is a unique store of value within the larger collectible asset landscape because of its lack of correlation with financial markets, which increases its usefulness in decorrelation-focused allocation strategies.
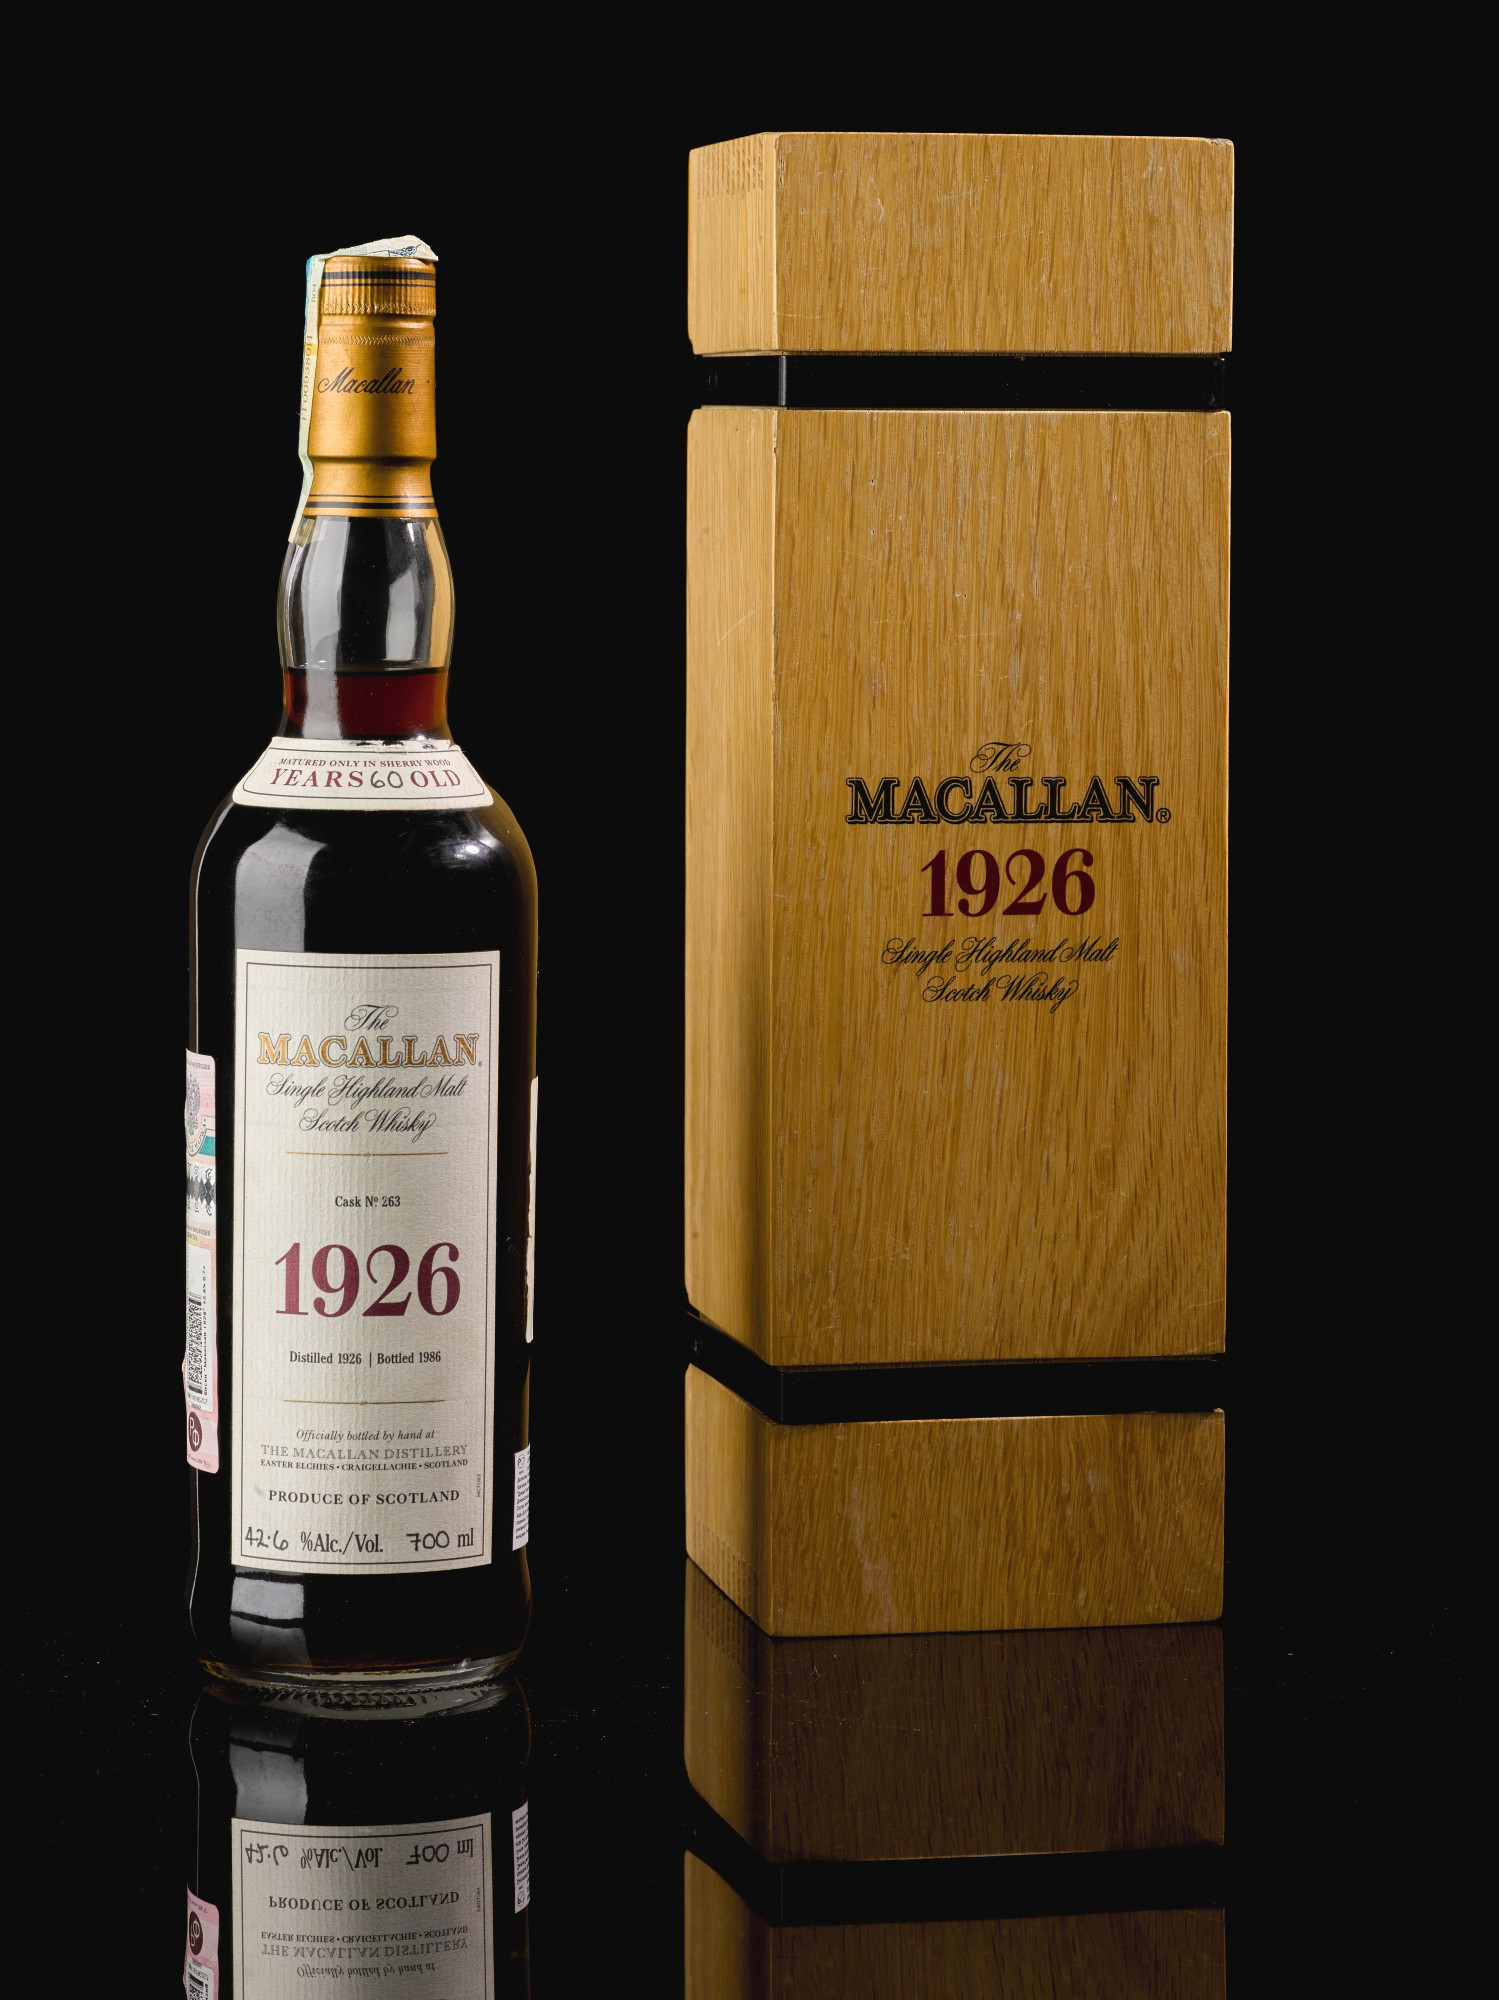
4.2.1.2 Whisky

This section examines the statistical correlation between rare whisky, as measured by the Rare Whisky Brora Index (RWB), and the wider financial markets as well as the producer stock that is linked to it (Diageo, the owner of the Brora distillery). Evaluating rare whisky's potential as a diversifying asset, separate from both conventional and alternative investment classes, is the aim.

The lack of statistically significant correlation between the Rare Whisky Brora Index and significant financial benchmarks supports the notion that collector-driven, idiosyncratic factors influence rare whisky prices. Given that the correlations for the MSCI World (0.073) and S&P Global Luxury Index (0.099) are both in the "no correlation" range, rare whisky seems to be largely unrelated to sentiment in the luxury sector as well as global equity cycles.

Interestingly, there is a weakly negative correlation (-0.221) between rare whisky and gold futures, suggesting a slight inverse movement with conventional safe-haven assets. This could imply that collectible whisky follows its own niche dynamics rather than acting defensively during emergencies. There is no correlation between Bitcoin (-0.051) and speculative digital assets.

Importantly, even when the company in question owns the brand and distillery, the correlation between the RWB Index and Diageo stock (0.014) is close to zero, indicating that the collectible whisky market is completely independent of corporate equity performance. This reflects fashions in art, handbags, and champagne.

The Brora Index, which represents rare whisky, functions as a real asset that is not correlated and is independent of the corporate, equity, commodity, or cryptocurrency markets. Rare whisky provides significant diversification value for investors looking for decorrelation, appreciation driven by scarcity, and cultural cachet. Its function as a stand-alone allocation category is highlighted by its statistical separation from producer stocks and larger markets. Rare whisky may act as a hedge against financial system entanglement and a store of value, especially for portfolios that are concentrated on long-duration, passion-driven, or inflation-resilient assets.
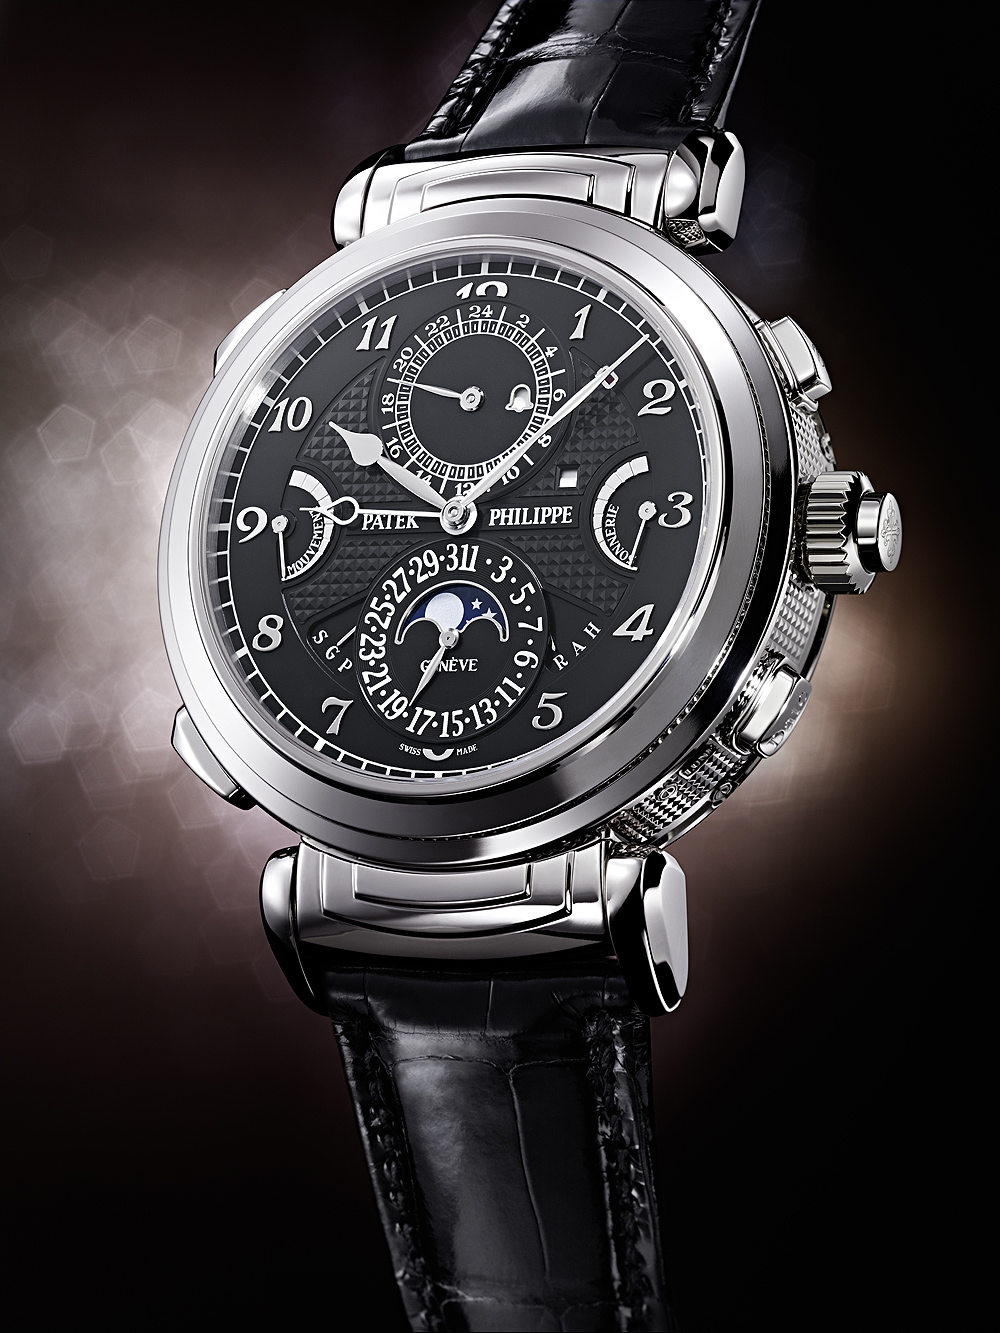
4.2.1.3 Watches
4.2.1.3.1 Watches with public company stock

The performance of luxury watches on the secondary market and the equity returns of the manufacturing conglomerates that produce them are examined in this section. The study focuses on watches made by publicly traded companies, including Hermès, Swatch Group, Richemont, and LVMH, and evaluates whether brand-specific collectible indices behave in sync with the stocks of their parent companies or the overall financial markets.

The secondary-market indices of collectible watches issued by publicly traded luxury companies show little correlation with the stock performance of their parent companies, according to the correlation coefficients. For example, there is a statistically insignificant correlation between Hermès stock and the WatchCharts Hermès Market Index of just 0.061. Swatch brand indices differ: the wider Swatch Group Market Index is at 0.156, while Omega and Breguet show only weak correlations with Swatch Group stock (0.105 and 0.195, respectively). None of these values, though, point to significant co-movement.

Similar trends are shown by LVMH's brands: the TAG Heuer and LVMH Market Indices have weak correlations with LVMH stock, corresponding to 0.109 and 0.152, respectively. Brands associated with Richemont, such as IWC (0.003), Jaeger-LeCoultre (0.015), and Cartier (0.123), all show only weak ties to Richemont equity. Interestingly, a number of Richemont watch indices show marginally negative correlations with their parent stock, including Vacheron Constantin (-0.075) and Montblanc (-0.076), suggesting that valuation drivers may be different.

The findings also apply to macro benchmarks. There is no discernible relationship between any watch index and Gold Futures, S&P Global Luxury, or MSCI World. The strongest correlations, TAG Heuer (0.386) and Cartier (0.325), are moderate and vary across brands, even with Bitcoin, which is notorious for its speculative activity. Collective market neutrality is suggested by the Near-zero correlation between the Overall Watches Market Index, which aggregates performance across all brands, and all financial indices.

A structurally distinct asset class is reflected in this independence across macro (index) and micro (corporate) metrics. The resale market's watch prices are influenced by supply constraints, collector demand, and brand desirability rather than equity valuations or general economic sentiment. The independence of the horological secondary market is highlighted by the empirical separation between the pricing of collectible watches and public equity markets. The price behavior of these collectibles is non-financial and deviates from the financial and strategic narratives of their manufacturers. Because their value comes from cultural capital rather than company balance sheets, collectible watches shouldn't be viewed as stand-ins for investing in luxury conglomerates.

Investors can diversify the risk of their portfolios by taking advantage of this uncoupling. Watches are good choices for low-correlation, alternative asset allocations because they exhibit little beta exposure to issuer stocks and macro markets. Rather than capital market cycles or earnings reports, collector psychology, rarity, and model-specific dynamics provide a better understanding of their value. According to the data, collectible watches—even those made by publicly traded companies—function in a different valuation ecosystem than conventional financial assets. Their appeal as robust, physical stores of wealth is strengthened by the fact that they more accurately reflect cultural values than financial performance.

4.2.1.3.2 Watches without public company stock

The statistical correlation between a few chosen financial market benchmarks and collectible indices for four separate luxury watchmakers—A. Lange & Söhne, Patek Philippe, Audemars Piguet, and Rolex—is examined in this section. Monthly returns from October 2015 to June 2025 served as the basis for the analysis. The MSCI World Index, the S&P Global Luxury Index Total Return, COMEX Gold Futures, and Bitcoin are among the financial benchmarks. These privately held businesses, which are not part of the public equity markets, provide a distinct perspective on the independent behavior of brand-driven collectibles in contrast to brands associated with listed conglomerates.

The information highlights a recurring pattern of non-correlation between the main financial market indicators and the independent watch brands. The Pearson coefficients for each of the four brands stay between -0.20 and +0.20, suggesting that there is no significant linear correlation between them and the S&P Global Luxury Index, the MSCI World Index, gold, or Bitcoin.

Significantly, A. Lange & Söhne exhibits the most inverse relationship among the benchmarks (-0.187 with MSCI World and -0.115 with the luxury index), suggesting slightly counterintuitive behavior while remaining within the statistical non-correlation threshold. The biggest and most powerful independent, Rolex, has weak and negligible positive correlations with MSCI World (0.096) and gold (0.065). These differences are slight and do not indicate tracking behavior or systematic dependence.

These results confirm that, even for internationally renowned and culturally iconic independent brands, watch prices in the secondary market are not influenced by macroeconomic or financial cycles. The notion that watch collectibles might co-move with speculative or sentiment-driven digital assets is also rejected by the lack of correlation with Bitcoin (e.g., -0.182 for Patek Philippe and 0.029 for Rolex).

The independent watch industry seems to operate solely on intrinsic, brand-specific dynamics, which are frequently influenced by production caps, waiting lists, model rarity, and collector loyalty—rather than by public market sentiment or risk-on/risk-off behavior—as opposed to the more general equity markets or commodities.

The analysis's findings support the idea that independent watches are uncorrelated alternative assets with unique return patterns that are not influenced by systemic risk factors. These brands are also shielded from corporate governance cycles, earnings reports, and equity market noise that could affect listed luxury goods companies due to their lack of public ownership. These assets are attractive to portfolio allocators because of their cultural durability and statistical insulation. In addition to their craftsmanship and scarcity, these watches offer protection from macroeconomic synchronization. They can therefore be used as key elements in diversified portfolios that focus on decorrelation, legacy investment themes, and capital preservation. The broader conclusion of this thesis—that the economic logic governing collectible markets is fundamentally different from that governing financial assets, with independence from listed equity markets continuing even in the absence of corporate exposure—is thus supported by this class of horological collectibles.
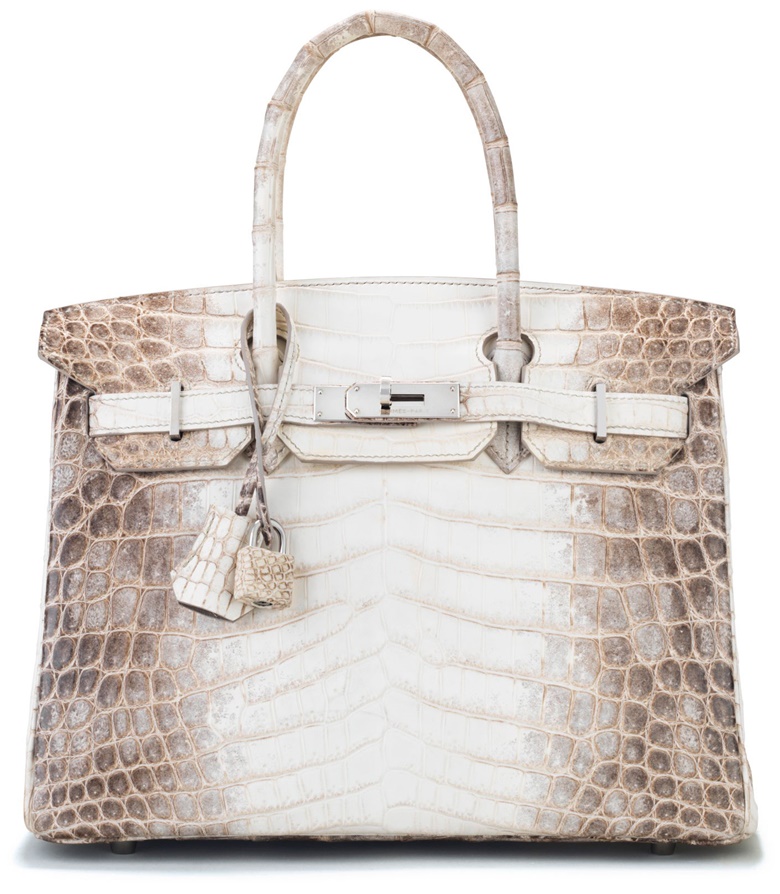
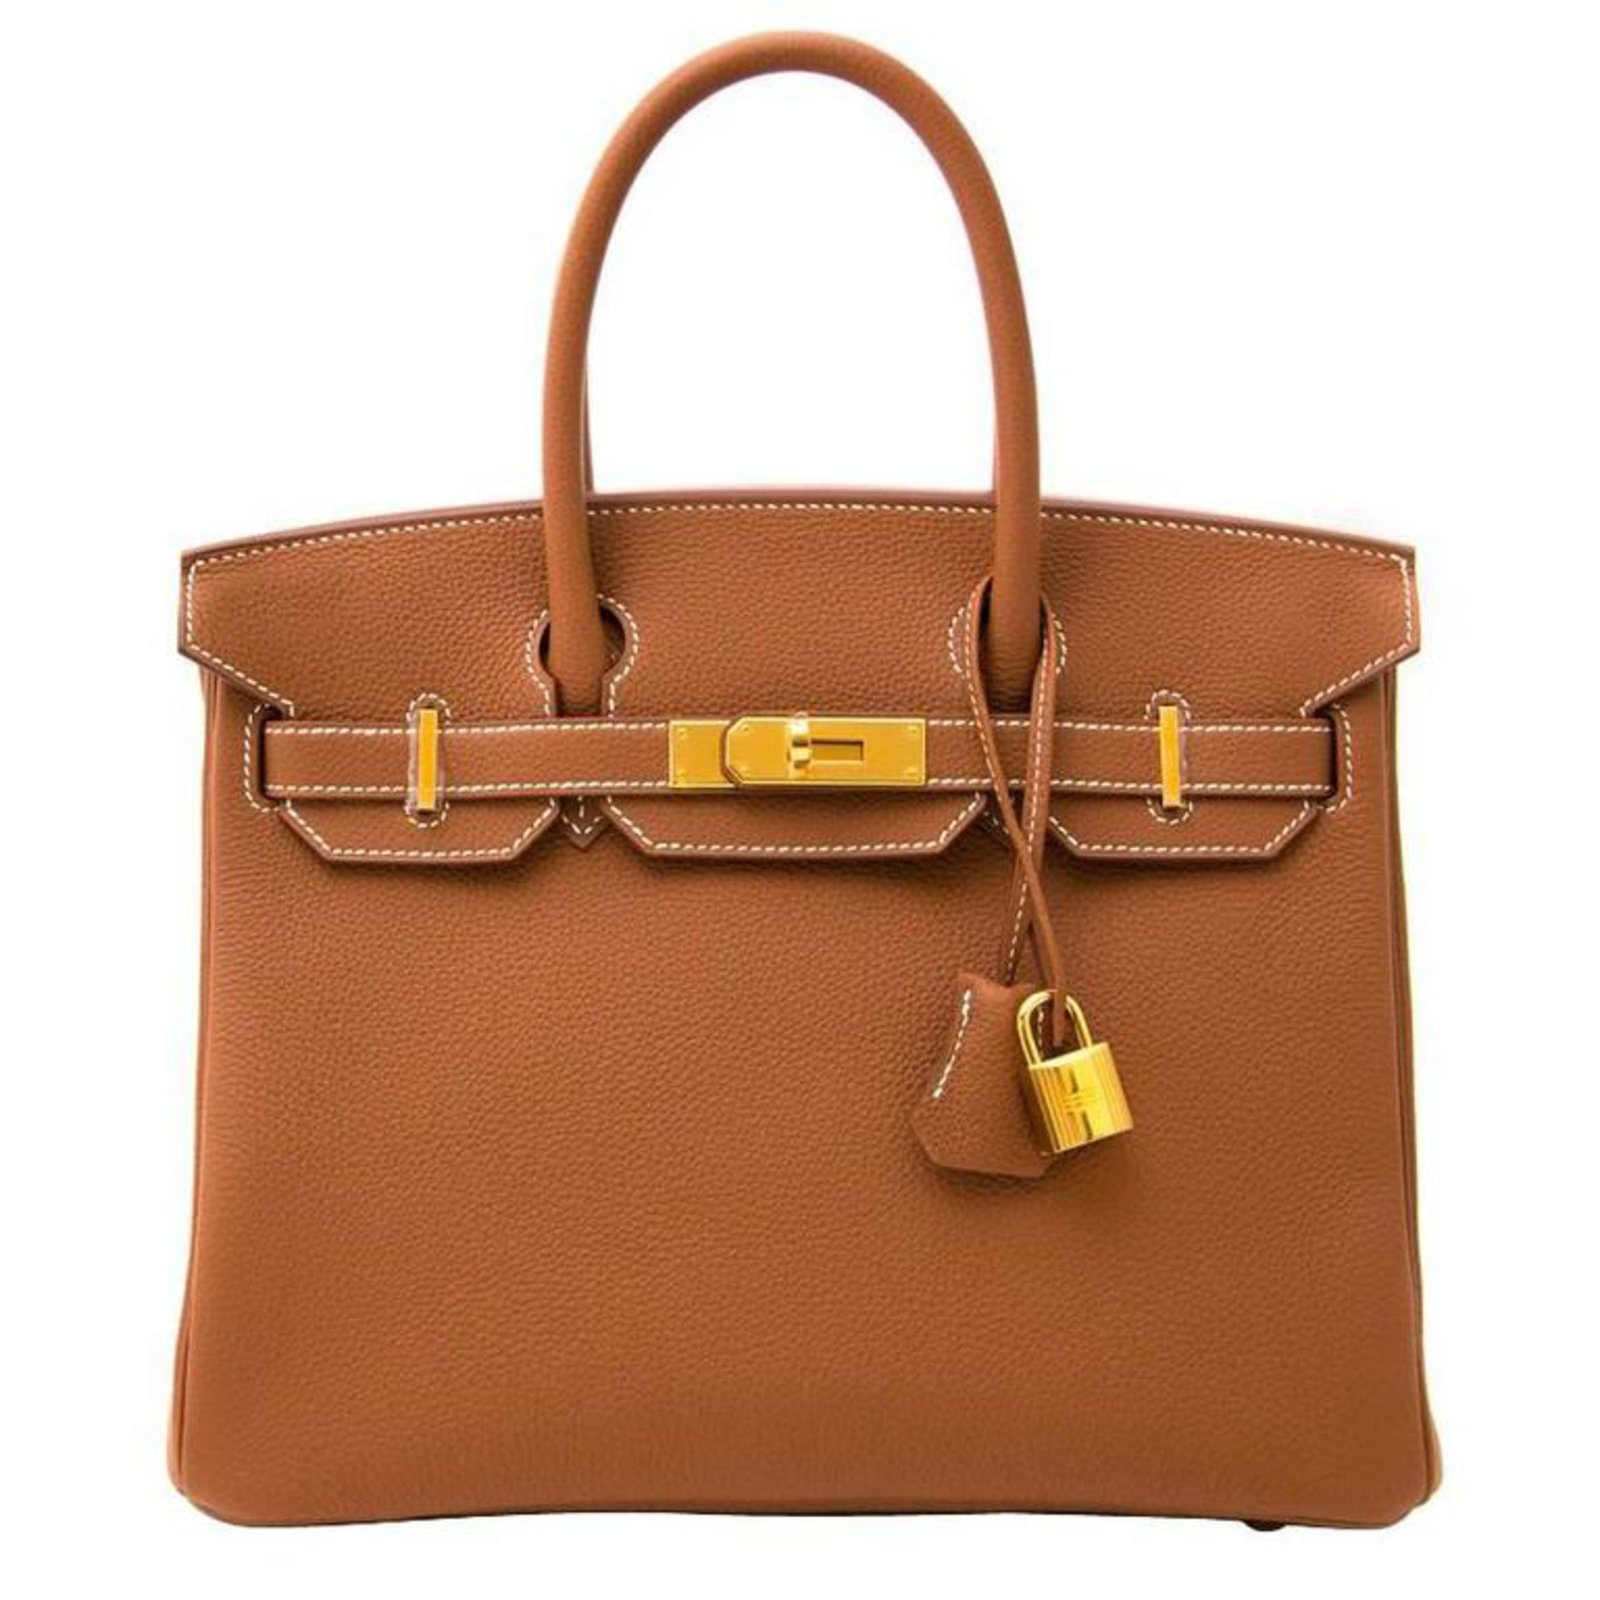
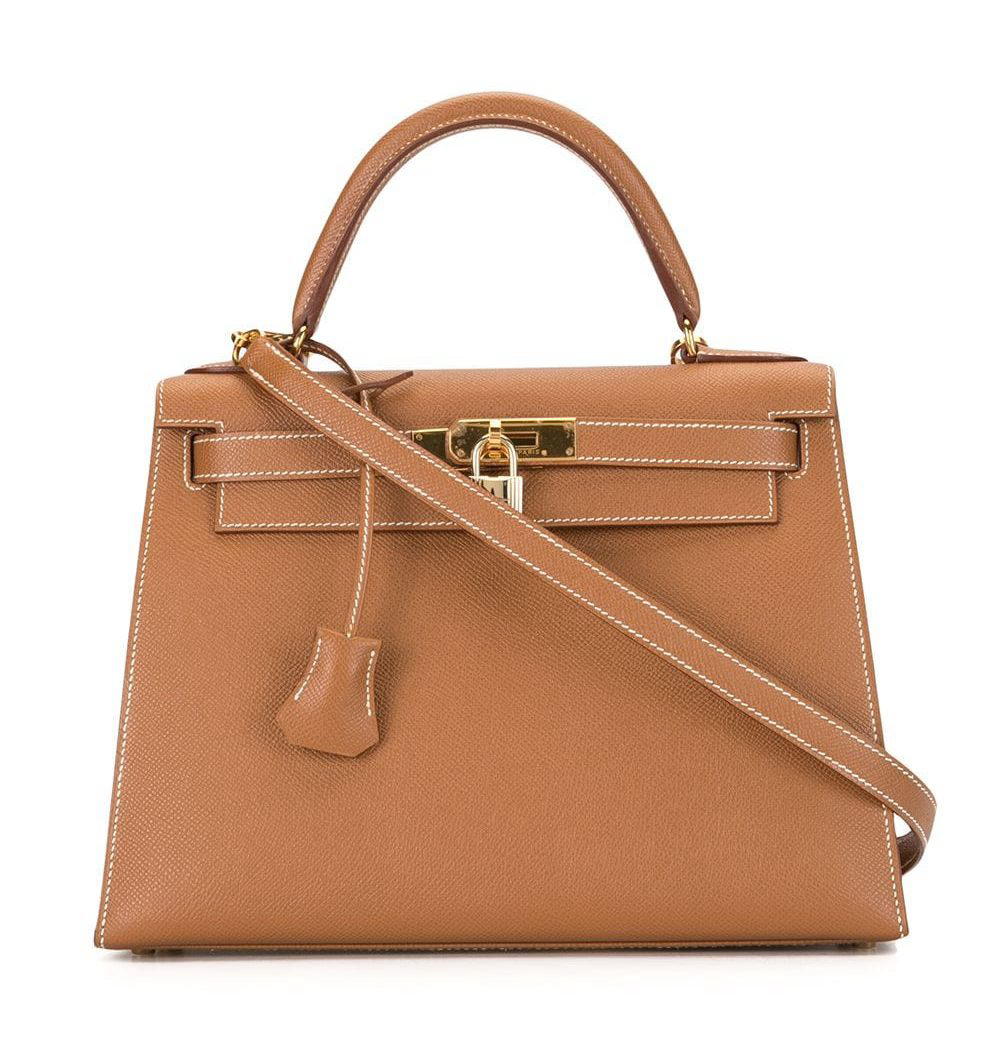
4.2.1.4 Handbags

The correlations between the MSCI World Index, S&P Global Luxury Index Total Return, COMEX Gold Futures, and Bitcoin, as well as three benchmark indices of Hermès handbags—Kirkin, Kelly, and Constance—are assessed in this section. In order to investigate the direct correlation between secondary market handbag valuations and the manufacturing company's corporate performance, the Hermès International stock (Euronext Paris) is also included.

High-end handbags appear to be relatively immune to macroeconomic and capital market forces, as evidenced by the statistically weak correlations between Hermès handbag indices and traditional financial market benchmarks. With weak positive correlations to both Bitcoin (0.242) and Gold (0.234), the Birkin index exhibits the most distinctive behavior among the three models. These numbers suggest a slight but significant behavioral similarity to other assets viewed as stores of value, especially in periods of speculative asset inflation or monetary devaluation.

The Kelly index, on the other hand, offers a more complex profile. Its valuation patterns may deviate even from the luxury sector as a whole, as evidenced by its weak correlation with the MSCI World Index (0.183) and negative correlation with the S&P Luxury Index (-0.123). With the exception of a weak negative correlation to gold (-0.130), the Constance index maintains near-zero to slightly positive correlations across all variables, further solidifying its status as a collectible asset caused by model-specific factors rather than external macro or market-wide dynamics.

Interestingly, there is very little correlation between the performance of Hermès' public stock and any of the three handbag indices. The Birkin index correlates at 0.029, Kelly at 0.089, and Constance at 0.060, confirming that the brand's financial performance and creation of shareholder value do not provide a meaningful explanation for secondary-market pricing. This ongoing disconnect is crucial because Hermès' equity returns do not forecast how its flagship models will perform in the resale market, despite having strict production controls and strong brand control.

It is evident that the Hermès handbag market functions as a decorrelated and independent collectible asset class, largely independent of both financial market developments and the company metrics of its producer. Because of their structural independence, luxury handbags are excellent diversification tools that are especially useful for alternative investment strategies that emphasize non-correlated return sources.

A growing narrative of handbags as material, luxury hedges may be reflected in the Birkin's weak association with gold and Bitcoin, although this trend varies among models. This emphasizes how crucial it is to choose specific assets within the handbag category. The result is a world where conventional valuation logic is superseded by aesthetic value, cultural symbolism, model-specific desirability, and fashion zeitgeist.

In the end, the data support the idea that luxury handbags, particularly Hermès's, are culturally anchored, non-financial micro-assets that are perfect for investors and collectors looking to protect themselves from traditional beta exposure and market volatility.
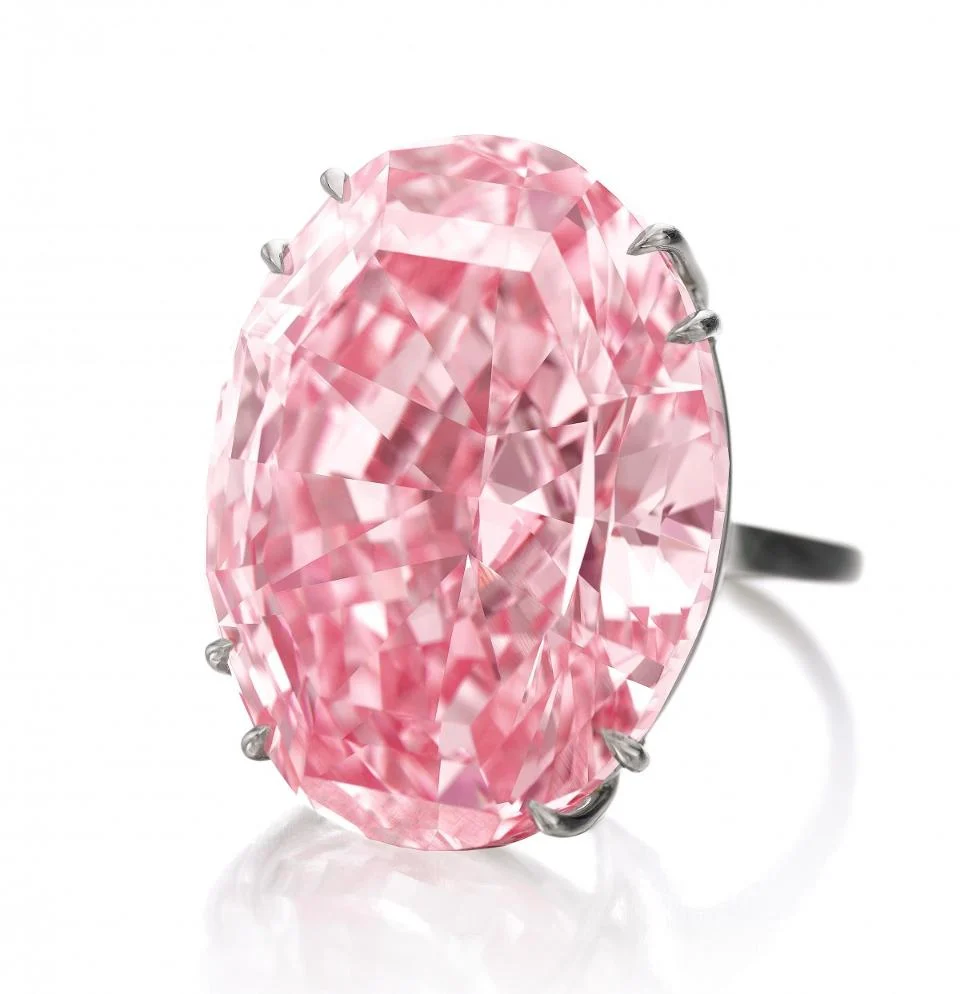
4.2.1.5 Diamonds

This section assesses the correlation between a set of financial market indicators and corporate equities related to the luxury sector and the IDEX Diamond Index, a benchmark for polished diamond prices. Monthly return data is used in the dataset. The MSCI World Index, S&P Global Luxury Index Total Return, COMEX Gold Futures, and Bitcoin are examples of benchmarks. Furthermore, the analysis incorporates equity data for three pertinent corporate entities with differing levels of involvement in the diamond and jewelry trade: Richemont, Signet Jewelers Limited, and LVMH (Euronext Paris).

The IDEX Diamond Index's status as a financially independent asset class is confirmed by the statistically insignificant correlations it shows with all tested benchmarks and corporate equities. According to the conventional Pearson interpretation, all coefficients stay below ±0.08, which is well within the "no correlation" range.

When it comes to financial markets, polished diamonds have almost no correlation with sentiment in the luxury sector (S&P Global Luxury: -0.023) or global equities (MSCI World: 0.045). Likewise, there is no proof that diamonds act as speculative alternatives or inflation hedges; their correlation with COMEX Gold is -0.070, while their correlation with Bitcoin is 0.050. These values run counter to conventional wisdom that portrays diamonds as defensive or contrarian assets, along with gold or cryptocurrency.

Correlations with major jewelry and luxury groups are still weak from a corporate perspective. Signet Jewelers, one of the biggest diamond retailers in the world, is virtually uncorrelated (-0.011), whereas LVMH, which owns diamond-heavy brands like Bulgari, only exhibits a weak correlation (0.076). This also holds true for Richemont (0.044), even though it owns luxury labels like Cartier. These findings imply that firms' share prices fluctuate independently of the underlying stone market, even when they generate sizable profits from the sale of diamonds.

This discrepancy most likely stems from the diamond market's structural characteristics, which include low liquidity, opaque pricing, and peculiar demand, especially from the bridal, ceremonial, and high-end custom segments. Furthermore, the market may be shifting away from traditional financial behavior due to factors like lab-grown diamonds and shifting generational preferences.

According to the IDEX Diamond Index, diamonds are a pure-play alternative asset that is unaffected by corporate performance, macroeconomic trends, or conventional hedging strategies. For investors who want exposure to assets motivated by cultural, emotional, and symbolic value rather than financial or monetary fundamentals, this makes them an excellent choice for non-correlated portfolio allocation.

Diamonds may play specialized roles in estate planning, legacy portfolios, or private wealth preservation strategies, but institutional adoption may be constrained by valuation opacity and illiquidity. By simply separating themselves from systemic risk, rather than by utilizing inverse market dynamics, their low-beta behavior strengthens their strategic use as a hedge against it.

In the end, intangible attributes like love, prestige, and tradition have a greater influence on the investment profile of diamonds than supply chains or corporate profits. In a world where diversification outside of the spreadsheet is becoming more and more sought after, this makes them not only non-correlated but also non-financially coded assets.

4.2.1.6 Classic cars

From October 2015 to June 2025, this section examines the relationships between a number of classic car market indices and significant financial benchmarks, such as global equity indices, gold futures, and Bitcoin (based on data from Aston Martin from October 2018). The K500 Ferrari Indices (pre-1958, 1958–1973, and post-1973), the K500 Porsche Index, the Pricing Culture Porsche Index, and the Pricing Culture Aston Martin Index are among the indices. To evaluate collectible-manufacturer alignment, corresponding publicly traded manufacturers are included: Ferrari (RACE), Porsche Holding SE (PAH3.DE), and Aston Martin Lagonda (AML.L).

The stocks of their respective manufacturers and financial benchmarks are not statistically related to classic car indices. Nearly zero or even slightly negative correlations exist between Ferrari's collectible indices, which span various eras, and the stock of Ferrari N.V. The 1958–1973 Ferrari segment's highest recorded coefficient (0.120) is still within the "no correlation" range, indicating that collector-specific factors rather than public market performance drive secondary market pricing for these cars. Potential inverse movements between corporate performance and vintage car valuations are indicated by the negative correlation (-0.078) between the Pre-1958 Ferrari index and Ferrari stock and the even stronger negative correlation (-0.079) between the Post-1973 index and Ferrari stock. Porsche exhibits a comparable pattern of separation between corporate equity and collectible assets. The K500 Porsche and Pricing Culture Porsche indices both have weak or insignificant correlations with Porsche Holding SE; the K500 Porsche index has a slight positive correlation of 0.086, while the Pricing Culture Porsche Index has a negative correlation of -0.120. The asset class's independence from larger financial market forces is further supported by correlations with macro benchmarks (MSCI World, S&P Luxury Index, Gold, and Bitcoin) that remain firmly within the no-correlation threshold.

The data from Aston Martin shows the most notable exception. The Pricing Culture Aston Martin Index shows moderately positive correlations with both the S&P Global Luxury Index (0.211) and its parent company AML.L (0.216). This suggests that the secondary market for Aston Martin vehicles may be more reflective of corporate strategic repositioning or broader brand reputation shifts than other marques. Even these readings, though, are below the threshold for a strong correlation. Although the MSCI World correlation is getting close to the weak positive correlation threshold, relationships with macro benchmarks such as MSCI World (0.146), Gold (0.043), and Bitcoin (0.015) are still statistically insignificant.

Vintage automobiles continue to be regarded as cultural assets that are highly unrelated. The information confirms that this category's valuation is mostly unrelated to systemic market forces or the financial performance of automakers. Rather, unique elements like rarity, cultural resonance, historical legacy, and collector fervor influence price. Ferrari collectibles and Ferrari stock have largely negative correlations, which suggests that corporate success may not translate into vintage appreciation. In fact, it may have the opposite effect, with corporate focus on modern production potentially diluting attention to heritage models.

This offers investors a strong chance to diversify their holdings. Classic cars are slow-moving, uncorrelated, real assets that are perfect for long-term allocation, especially in portfolios that aim to protect against correlation shocks or market cycles. Aston Martin's minor exceptions serve as further evidence of how brand revival narratives can introduce partial alignment by providing a nuanced compromise between financial market sentiment and passion asset independence. The negative correlations found in a number of Ferrari indices imply that, in times of robust corporate performance in the automotive industry, investing in vintage cars may offer counter-cyclical advantages in addition to diversification.

4.2.1.7 Sneakers

This section examines the relationship between a few chosen financial and corporate benchmarks and the CRWDSNKR Index, a measure of secondary-market sneaker resale prices. The sample period has monthly return intervals and runs from October 2015 to June 2025. The MSCI World Index, S&P Global Luxury Index Total Return, COMEX Gold Futures, and Bitcoin are examples of reference indicators. In order to evaluate alignment with the leading corporate actor in the sneaker market, especially in the collectible and limited-edition domain, the Nike stock price is also included.

The CRWDSNKR Index is statistically independent of its most significant corporate issuer as well as financial markets. The "no correlation" threshold (±0.00 to ±0.19) is reached by all five correlation values, suggesting that there is no significant association with either company-specific or macroeconomic drivers.

The strongest correlation, albeit statistically weak, is with gold (-0.284). This is different from traditional luxury collectibles, such as vintage cars or handbags, which sometimes have a weak correlation with gold as an inflation hedge. Conversely, the way sneakers behave is not affected by the cycles of commodities. Furthermore, there is no discernible co-movement between MSCI World (-0.217) and Bitcoin (-0.095), casting doubt on the notion that sneaker markets mirror the performance of broader stocks or speculative digital assets.

Given Nike's pivotal role in the sneaker ecosystem, the lack of alignment with their stock (-0.140) is particularly noteworthy. This implies that factors such as limited releases, cultural significance, resale hype, and influencer-driven momentum, which are mainly unrelated to corporate profits, control the secondary sneaker market.

Although there is some overlap in branding strategy and exclusivity marketing approaches, the slight positive correlation with the S&P Global Luxury Index (0.054) does not suggest any significant behavior commonality with high-end luxury goods.

The market-independent and culturally-driven nature of the collectible sneaker segment is confirmed. A self-contained market characterized by community-based value systems, scarcity mechanics, and stylistic cachet rather than corporate performance or financial cycles is revealed by the lack of correlation with both Nike's public equity and macroindices.

Sneakers have special value as non-correlated portfolio diversifiers because of their autonomy, which makes them especially attractive to allocators looking to gain exposure to Gen Z cultural capital, streetwear-related trends, or urban consumption narratives. Sneaker collecting may offer portfolio exposure to generational wealth transfer and changing luxury consumption patterns that traditional financial instruments are unable to capture due to its demographic appeal. Moreover, the weak and directionally negative correlation with Nike's stock highlights the distinction between owning a company's equity and owning the cultural artifacts that fuel secondary-market enthusiasm, indicating that even dominant brand exposure does not produce mirrored market behavior. Celebrity endorsements, social media influence, and subcultural significance are some of the factors that drive the collectible nature of limited-edition sneakers as cultural assets rather than corporate proxies. These factors function independently from conventional business performance metrics

4.2.1.8 Art

This section looks at the relationship between the main financial and alternative asset classes and the Art Market Research Index, a thorough benchmark that tracks worldwide trends in fine art auction pricing. The analysis contrasts changes in art prices with the MSCI World Index, S&P Global Luxury Index Total Return, COMEX Gold Futures, and Bitcoin using monthly return data from June 2015 to June 2025. We can evaluate the relationships between the fine art market and digital assets, safe-haven commodities, the luxury market, and traditional stocks using this framework.

When compared to the financial and alternative asset classes under study, the fine art market consistently exhibits either no correlation or a weak negative correlation. The correlation with MSCI World (-0.139) demonstrates that art prices may fluctuate independently of general market sentiment rather than following the cycles of global equities. Art's standing as a low-beta asset class, shielded from the business cycle and geopolitical volatility that normally propel financial markets, is strengthened by this misalignment.

The correlation between fine art and the S&P Global Luxury Index (0.045) is practically zero, indicating that fine art functions according to different dynamics even within the larger luxury ecosystem. The pricing of artworks is largely determined by factors like artist reputation, exhibition exposure, auction house momentum, and collector demand, none of which consistently translate into changes in the stock prices of luxury conglomerates, in contrast to luxury goods, which frequently follow trends in consumer sentiment and discretionary spending.

Interestingly, there is a weak negative correlation (-0.254) between the art market and COMEX Gold Futures. Although gold and art are both frequently regarded as stores of value, the information presented here indicates that under specific market circumstances, their movements may differ. The fact that gold responds to inflation expectations and financial uncertainty while art is influenced by longer-term cultural capital, ultra-high net worth individuals' wealth preservation strategies, and supply constraints brought on by artist lifecycles may be a reflection of different investor psychology.

The sharp contrast between fine art and cryptocurrency assets is further highlighted by the correlation with Bitcoin (-0.164), which stays within the no-correlation zone. Art does not have the extreme volatility, digital liquidity, or sentiment-driven behavior of cryptocurrencies, even though both are non-income-generating and have occasionally been labeled as speculative. Art may even act as a partial counterweight in diversified portfolios that contain digital assets, as the lack of co-movement implies that it is not subject to the same boom-bust cycles.

This analysis shows that art is a statistically independent asset that is not correlated with alternative hedges or financial markets. Its independence emphasizes its value as a decorrelated store of value, which makes it especially appealing for long-term investors and wealth preservation plans. Although both assets may draw capital during uncertain times, their underlying drivers are essentially different, as indicated by their weak negative relationship with gold.

Fine art makes a strong argument for investors looking to gain exposure to cultural value, scarcity, and aesthetic capital as opposed to earnings growth or commodity cycles. Although there are still issues with illiquidity and valuation opacity, art pricing is a strong tool for building stable, alternative-tilted portfolios due to its decorrelation benefits and resilience to macro shocks. Though investors must balance these advantages against the sector's modest absolute returns during the studied period, the consistent negative correlations across multiple asset classes imply that art may serve as a potential hedge against specific market conditions in addition to being a diversifier.

4.3 Linear regressions: test H2 & H4

Following the correlation analysis, this section tests Hypotheses 2 (whether collectibles markets are linearly linked to their manufacturer stocks) and 4 (whether collectibles are linearly related to selected stock market indices, gold, and digital assets) using linear regression methodology on excess returns. Regression analysis offers more in-depth information about predictive relationships, statistical significance, and the degree of influence between variables than correlation analysis, which only shows the direction and strength of relationships.

The regression framework uses two different analytical techniques and treats collectible excess returns as dependent variables. In order to determine whether corporate financial success translates into collectible value appreciation, the first regression series compared collectible performance to manufacturer stock performance. Through an analysis of connections with global equity indices, commodity markets, and digital assets, the second series explores collectible sensitivity to broader market forces.

Whether collectibles function as market-neutral substitutes or show recurring connections with conventional and alternative financial assets are among the basic questions the analysis attempts to answer.

By using a dual regression approach, it is possible to uncover subtle relationships between collectibles and different market factors by identifying specific correlation patterns that might not be visible through straightforward correlation analysis. The methodology offers vital proof for risk management plans and portfolio construction choices involving luxury collectibles as alternative investments.

4.3.1 Linear Regressions: Collectibles vs Company Stock & Market Indices

A remarkable pattern emerges from the regression analysis: there are no significant statistical relationships between collectibles and the stocks of the companies that produce them, but there are a number of noteworthy correlations with alternative assets and broader market indices.

4.3.2 Linear Regressions: Collectibles vs Market Indices and Digital assets: Selective Correlation Patterns

When comparing collectibles to alternative assets and larger market indices, the analysis paints a more nuanced picture. In contrast to the steady independence from company stocks, a number of significant statistical relationships surface that demand careful analysis.

4.3.2.1 Significant Positive Relationships

The most notable discovery focuses on correlations between digital assets. An emerging correlation between the appreciation of vintage Ferrari and cryptocurrency market cycles is suggested by the strong positive relationship between Bitcoin and the K500 Ferrari 1958–1973 index (p < 0.001). This correlation suggests that the adoption of digital assets by collectors of mid-century Ferrari models may be influenced by comparable macroeconomic forces or demographic trends.

Across several brands, the luxury watch market exhibits especially high levels of digital asset sensitivity. Bitcoin and the WatchCharts TAG Heuer Market Index have a strong positive correlation (p = 0.014), suggesting that the collectible performance of this Swiss luxury brand follows the cycles of the cryptocurrency market. Beyond cryptocurrencies, this correlation between digital assets also exists in conventional luxury markets. Additional sensitivity is shown by the Cartier index, which has a strong positive correlation with the S&P Global Luxury Index TR (p = 0.043). At the nexus of traditional luxury and new digital wealth, the TAG Heuer and Cartier findings collectively imply that luxury watches serve as both alternative assets sensitive to digital market dynamics and luxury goods responsive to broader affluent consumer sentiment.

4.3.2.2 Significant Negative Relationships

Two significant relationships that demonstrate the potential hedging qualities of collectibles exhibit counter-cyclical behavior. Fine wine markets move against the performance of luxury equity, as evidenced by the strong negative correlation (p = 0.046) between the Liv-ex Champagne 50 index and the Stock Market Luxury Index. According to this counter-cyclical behavior, champagne investments could help diversify portfolios with a luxury focus and do well when luxury stocks are under pressure.

Art markets may act as alternative stores of value that move inversely to conventional safe-haven assets, according to research on art markets, which shows a strong negative correlation with gold futures (p = 0.011). Fine art is positioned as a sophisticated portfolio hedge because of this inverse correlation, which suggests that art markets may outperform other markets when investors turn to gold during times of market stress.

4.3.2.3 Statistical Interpretation

Perhaps the most important development is the integration of digital assets, as luxury watches and vintage Ferraris are among the collectibles that are becoming more sensitive to fluctuations in the cryptocurrency market. This correlation could be the result of similar store-of-value functions, overlapping investor demographics, or a shared sensitivity to inflation expectations and monetary policy.

The dynamics of luxury ecosystems vary depending on the collectible category. While certain segments, like champagne, move counter-cyclically and offer inherent hedging characteristics within luxury-focused allocations, other segments, like Cartier watches, show a clear correlation with the performance of the larger luxury stock market. The relationship between art and gold is where alternative asset substitution effects are most noticeable, as fine art seems to serve as a sophisticated substitute for conventional safe-haven assets. This connection supports art's positioning as a store of value that could perform better when conventional hedges are under pressure.

4.3.2.4 Investment Implications

Beyond the benefits of simple diversification, the regression results support a more nuanced view of collectibles in portfolio construction. While selective correlations with market indices offer controlled exposure to particular factors and cycles, independence from company stocks offers true portfolio diversification.

Through collectibles, which may provide better liquidity, cultural appreciation, or physical fulfillment than direct exposure, these selective market exposures give investors access to luxury cycles and digital asset trends. Counter-cyclical correlations, such as those between luxury stocks and champagne or art and gold, point to possible defensive qualities that might improve portfolio resilience in times of market stress. The new associations with digital assets and Bitcoin point to changing market dynamics that need constant observation. These connections may deepen or change as generational wealth transfer quickens and cryptocurrency adoption matures, possibly resulting in the development of new channels for the transfer of digital and tangible alternative assets.

Chapter 5: Limitations

While providing in-depth analysis into luxury collectibles as a form of alternative investments, this research has a number of practical as well as methodological limitations that must be taken into account in the interpretation of the findings. These limitations traverse data quality, methodologies, market coverage, as well as the intrinsic challenges of analyzing alternative asset classes.

5.1 Data quality and availability constraints

The first of these restrictions is significant variation in data availability and quality between collectible types. While mature markets such as fine wine have systematic reporting of trades through marketplaces such as Liv-ex, most collectible markets are driven by auction house data and off-market sale data which may not always represent the entire market. Some collectibles were excluded by this study, such as Gucci, due to the absence of full price indices. Unlike traditional categories with institutional monitoring infrastructure, no systematic price discovery infrastructure is available in the market for Gucci collectibles that could facilitate strong quantitative analysis. But several of the Kering stable's collectibles warrant closer inspection, such as period Gucci luggage like the Jackie 1961 bag, Bamboo Handle luggage from the 1940s, and Tom Ford years items between 1994 and 2004 that are quickly gaining collectible status.

Data quality issues are not limited to designated indices since estimated data sources bring forth possible measurement errors. The analysis of Hermès handbags is based on estimated data using LuxPrice-index, which, although being the most available source, introduces possible inaccuracies that can distort performance calculations. Similarly, application of June 2024 Liv-ex Fine Wine 1000 composition figures to calculate our studied performance involves temporal bias since the index experienced substantial compositional shifts during the research period. The variable nature of index constituent selection means wines comprising the index during 2015 are substantially different from wines comprising the index during 2025, which could induce historical performance attribution bias.

One particularly significant area of information vacuum is the cognac market, which has no established index platform to access as exists for other comparable luxury spirits categories. While whisky has had indices such as the Rare Whisky 101 series established, and wine enjoys extensive coverage through the Liv-ex Fine Wine 1000, there are no free systematic cognac performance data. This is a significant analytical constraint considering that cognac accounts for an estimated 55–60% of Wines & Spirits segment revenue at LVMH. While cognac has seen rising demand from collectors, especially for special releases of prestige houses like Hennessy, Rémy Martin, and Martell, sales are primarily conducted by private sales and specialist dealers in the absence of centralized price discovery systems. The absence of comprehensive cognac performance data could lead this study to underestimate the overall investment potential of luxury spirits, particularly given the heritage status of cognac and the premiums at which aged expressions and limited releases carry.

5.2 Statistical analysis temporal constraints

A primary methodological deficiency affects the power of our statistical tests, including correlation matrices, Sharpe ratio point estimates, beta coefficients, linear regression tests, and measures of volatility. These must be estimated on the basis of available monthly observations per asset. Academic literature imposes rigorous minimum observation requirements upon these statistical estimates: Lo (2002) demonstrates Sharpe ratio standard errors to be roughly √((1+0.5 × SR²)/n), and correlation analysis and beta estimate using CAPM regression typically require similar sample size requirements for statistical sufficiency (Dimson, 1979; Jobson and Korkie, 1981). Financial econometrics must have at least 36 monthly observations for basic statistical significance testing, and 60+ monthly observations for robust inference in regression analysis and correlation matrices (Campbell et al., 1997).

5.3 Methodological constraints and model applicability

Using the standard finance models, including the Capital Asset Pricing Model (CAPM) and Sharpe ratio calculations, on alternative assets is riddled with methodological weaknesses. The models assume efficient markets, normally distributed returns, and rational investor behavior that do not necessarily apply to passion assets driven by passionate, cultural, and aesthetic forces. Use of stock market indices as performance yardsticks for collectibles, while necessary in comparative context, may fail to capture the unique risk-return characteristics of physical assets determined by rarity, aesthetics, and cultural affinity rather than cash generation.

The correlation model, while statistical accuracy, may not accurately capture the complex dynamics between collectibles and their manufacturing firms. The linearity hypothesis among the variables is disregarding the potential of non-linear dynamics, threshold effects, and regime changes that would have significant implications on adjusting the risk-return profiles under different conditions of the market. In addition, logarithmic returns, while mathematically beneficial, may not be the optimum transformation to use for assets experiencing discrete jumps in value due to authentication breakthroughs, provenance announcements, or cultural valuation adjustments.

5.4 Sample selection and survivorship bias

This analysis is plagued with survivorship bias inherent in it, which considers only successful collectible categories and established luxury brands. Culling systematically from the data set are losers on the collecting front, discontinued lines, and brands losing market share, which could exaggerate the attractiveness of collectibles as an asset class. Selection criteria naturally bring about bias towards categories with sufficient market presence to build good indices, thereby eliminating nascent or niche collectible markets that could yield other risk-return profiles.

5.5 Temporal and economic context limitations

The last decade study timeframe overlaps with a period of unprecedented monetary growth and ultra-low interest rates that could have artificially driven alternative asset prices up. The unorthodox monetary policies adopted by major central banks in the aftermath of the global financial crisis provided a setting of high liquidity and yield deprivation that most likely supported the solid performance of numerous collectible categories examined in this study. These conditions may not be generalizable to long-run market conditions, and hence the relevance of the findings to other monetary policy situations or business cycles cannot be guaranteed.

The absence of deep economic downturns in much of the study period bars the analysis from fully capturing the downside protection qualities of collectibles during periods of extreme market distress. The brief 2020 COVID-19 market shock provides limited evidence about collectibles behavior in extended economic downturns, potentially overstating their defense relative to traditional assets.

5.6 Geographic and cultural coverage limitations

This research has significant geographic bias, with focus on Western auction houses, vintage luxury markets, and taste among European-American collectors. The world in transition, local collecting behavior, and non-Western luxury cultures remain poorly represented, although they are able to offer alternative risk-return profiles.

The preponderance of European auction houses in our sample therefore under-estimate global collectibles markets. This may be particularly so against a backdrop of a growing role for Asian collectors and considerable regional disparity in aesthetic preferences and valuation modes. While affluent Asian collectors may be coloured in their tastes by the West, the rise of Asian auction houses suggests changing market forces requiring independent investigation on grounds other than assumptions of identical global tastes.

The cultural specificity of certain collectible classes creates additional limitations. Wine analysis overemphasizes French regions, watch analysis focuses on Swiss makes, and art indexes report primarily Western artists. This focus by culture could lower the global applicability of findings and omit important regional collectibles markets that can provide competing diversification benefits.

5.7 Transaction costs and practical investment considerations

The analysis also downplays actual-world aggravations and costs of investing in physical collectibles. Fees like authentication charges, provenance checks, conservation reports, insurance premiums, storage fees, and periodic maintenance are not effectively incorporated into return projections. Markups by dealers, auction house commissions, and the bid-ask spreads that are common in collectibles markets can actually reduce net returns, particularly for retail investors without access to institutional prices.

Liquidity constraints are another significant real-world limitation not entirely captured within the quantitative environment. Public securities tend to have longer promotional phases, needed expertise for best timing, and access to appropriate sale channels. Collectibles are treated by the analysis as if they enjoy stock-type liquidity, when in actuality time-to-sale and transaction surety are far less than traditional assets.

5.8 Market maturity and development stage variations

development and institutionalization that are enormously different. Fine wine and art markets enjoy centuries of collector history and mature valuation techniques, whereas markets for sneakers and modern watches are comparatively new with little historic precedent. Patterns of performance observed at stages of market development may not continue when such markets become mature, which can diminish the utility of the analysis in forecasting future investment.

The emergence of new market infrastructure like online platforms, authentication technologies, and fractional models is rewriting the universe of collectibles investing at a speed that historical data cannot capture. The analysis therefore captures snapshots of markets that are developing, not mature and stable investment categories.

5.9 Regulatory and external factor limitations

This study fails to adequately consider the varying tax treatments of collectibles across jurisdictions that can materially impact net returns to investors. The risk of changing regulations on import/export of luxury items, cultural patrimony laws, and altering authentication guidelines can have a material influence on future market dynamics that is not captured by past analysis.

Social and environmental governance concerns, more institutional investor-focused, are not included in the analysis. Global collectibles trading carbon footprint, labor practices in manufacturing, and sustainability of luxury production could become material considerations driving future valuations.

5.10 Model limitations and statistical constraints

The statistical inference is made with assumptions that may not be applicable to collectibles markets. Stationarity of time series, normal distribution of returns, and linearity may not be applicable for assets whose prices are determined by cultural change, technological breakthrough, and evolving collector fancies. The short time series for most assets drains the statistical power of analysis and increases the likelihood that spurious rather than true relationships will show up statistically significant.

The correlation framework, although yielding intriguing patterns, is not able to determine causality between collectibles performance and general market forces. The associations found are likely due to shared underlying factors and not direct causes and effects, thus limiting the applicability of the results for forecasting.

These limitations in aggregate advise that although this study yields rich insights into luxury collectibles performance traits, the outcomes need to be viewed as indicative and not as definitive. The findings are best considered to establish the viability of collectibles as alternative investments in an intuitive sense, rather than to give exact quantitative advice for portfolio allocation choices. Subsequent research overcoming these limitations by using longer time series, wider geographical areas, and more advanced modeling techniques would greatly increase our knowledge about collectibles as an asset class.

Chapter 6: Conclusions

Both scholarly research and real-world investment management benefit greatly from our empirical investigation of luxury collectibles as alternative investments. This study confirms through a thorough quantitative analysis conducted between 2015 and 2025 that luxury collectibles have unique risk-return characteristics that go against the presumptions of traditional portfolio theory. The study advances knowledge of the best asset allocation in modern financial markets by showing that certain collectible categories produce superior risk-adjusted returns while offering real diversification benefits.

6.1 H1: Collectible-manufacturer correlations

Stronger brand equity and corporate performance should result in positive correlation patterns between company equities and their corresponding collectible assets, according to the first hypothesis, which predicted that collectibles markets would be positively correlated to their manufacturer stocks. According to theoretical frameworks, prosperous luxury businesses should see a correlation between their financial success and the value of their tangible goods in collector markets.

Across all tested categories, the correlation analysis shows a startling pattern of statistical independence rather than positive correlation. Correlation coefficients continuously stayed within or below the "no correlation" threshold of ±0.20, even after looking at over thirty collectible-manufacturer pairs from a variety of luxury sectors. The majority of these relationships displayed very weak positive or even slightly negative correlations.

Considering the brand equity hypothesis's intuitive appeal, this systematic lack of positive correlation is especially noteworthy. Even though LVMH is a major producer of champagne with well-known brands like Dom Pérignon, Krug, and Veuve Clicquot, the correlation between its stock and the Champagne Index is only 0.140. Similarly, despite owning the Brora distillery and controlling the brand's history, the correlation between Diageo stock and the Rare Whisky Brora Index is only 0.014. Just 0.061 is the correlation between Hermès stock and the WatchCharts Hermès Market Index, and the same trends hold true for all other manufacturer-collectible pairings that were looked at.

The hypothesis is therefore rejected based on the comprehensive absence of positive correlations between collectibles markets and their manufacturer stocks. This systematic independence validates that collectibles derive value from factors fundamentally different from corporate financial performance, establishing them as genuinely distinct asset classes rather than correlated expressions of brand equity performance.

6.2 H2: Collectibles Markets and Manufacturer Stock Linkages

In order to test whether corporate equity performance could systematically predict or explain collectible value movements through quantifiable regression relationships, the second hypothesis postulated that collectibles markets would be linearly linked to their manufacturer stocks. This hypothesis looked at the basic question of whether luxury companies' financial success directly correlates with predictable patterns of appreciation in collector markets for their physical products.

Across all categories analyzed, the regression analysis shows a complete lack of significant linear relationships between collectibles and the stocks of the companies that produce them. P-values consistently surpassed the 0.05 significance threshold, indicating no statistically significant linear predictive relationships based on excess returns, even after more than thirty collectible-manufacturer pairs from various luxury sectors were systematically tested. Examples of these pairs included Hermès handbags versus Hermès stock, Ferrari classic cars versus Ferrari equity, and specialty whiskies versus Diageo shares.

Given the theoretical appeal of the brand-equity linkage hypothesis, this systematic independence turns out to be especially noteworthy. Despite LVMH's leading position in champagne production, there is no discernible correlation between the stock of the company and the Champagne Index when the two are regressed. Similarly, even though Diageo owns the Brora distillery and is in charge of the brand's history, regression analysis between the Rare Whisky Brora Index and Diageo stock shows no predictive power. There is no linear correlation between the WatchCharts Hermès Market Index and the performance of Hermès stocks, and this pattern holds true for all other manufacturer-collectible regression models that were looked at.

The hypothesis is therefore rejected based on the comprehensive evidence that no linear linkages exist between collectibles markets and their manufacturer stocks. By establishing collectibles as truly separate asset classes rather than equity proxies or brand performance derivatives, this methodical disconnection confirms that they function according to valuation mechanisms that are essentially independent from corporate financial performance.

6.3 H3: Collectibles Correlations with Financial Markets

The third hypothesis examined whether collectibles show significant correlation patterns with broader financial market indicators such as global equity markets, commodity prices, and digital assets. It also looked at whether collectibles are correlated with specific stock market indices, gold, and digital assets. The role of collectibles as alternative stores of value or as assets that are sensitive to market fluctuations was the subject of this hypothesis.

There is strong evidence from the correlation analysis that luxury collectibles function statistically independently of the majority of conventional and alternative financial markets. The majority of correlations with major benchmarks fell well below ±0.10, and correlations with all nine categories (including champagne, whisky, watches, handbags, diamonds, vintage cars, sneakers, and art) consistently stayed within the "no correlation" threshold of ±0.20.

The analysis does, however, show a few noteworthy outliers that point to complex relationships rather than total market independence. At -0.254, the Art Market Research Index exhibits a weakly negative correlation with Gold Futures, and at -0.245, the Liv-ex Champagne 50 exhibits a weakly negative correlation with the S&P Global Luxury Index. Certain collectibles, like the Hermès Birkin index at 0.242, exhibit weak correlations with Bitcoin, indicating selective sensitivity to changes in digital assets.

Most importantly, the correlation patterns show that collectibles do not consistently exhibit safe-haven qualities like gold or serve as systematic proxies for larger market movements. Rather, they function as truly non-correlated alternative assets with sporadic selective relationships that differ depending on the market and category.

The hypothesis is largely rejected based on the comprehensive evidence that collectibles demonstrate statistical independence from most selected stock market indices, gold, and digital assets. The observed selective correlations, however, point to complex substitution effects in which specific collectibles might play different roles in different market situations, benefiting portfolios through independence rather than correlation.

6.4 H4: Collectibles Markets and Broader Financial Market Linkages

In order to determine whether more general financial market indicators could systematically predict or explain collectible performance through quantifiable regression relationships, the fourth hypothesis postulated that collectibles markets would show linear links to specific stock market indices, gold, and digital assets. This hypothesis examined whether collectibles show predictable sensitivity to trends in digital assets, global equity markets, the dynamics of the luxury sector, or changes in commodity prices.

Several statistically significant relationships that show selective rather than systematic links with larger financial markets are revealed by the linear regression analysis, which paints a more complex picture than simple market independence. Some collectibles exhibit significant linear relationships with particular market indicators while remaining independent of others, in contrast to the persistent lack of manufacturer relationships.

The most notable results focus on new correlations between digital assets. The K500 Ferrari 1958–1973 index showed a strong positive linear relationship with Bitcoin (p < 0.001), indicating that vintage Ferrari appreciation and cryptocurrency market cycles are predictive. In the luxury watch market, the WatchCharts TAG Heuer Market Index and Bitcoin have a strong positive linear relationship (p = 0.014), and the WatchCharts Cartier Market Index has a significant positive relationship (p = 0.043) with both Bitcoin and the S&P Global Luxury Index TR. These correlations imply that some collectibles are becoming more sensitive to changes in the luxury market and digital asset movements.

Two noteworthy examples that demonstrate possible hedging traits in collectible portfolios show counter-cyclical relationships. Fine art is positioned as an alternative store of value that may outperform during times when traditional safe-haven assets are under pressure, as evidenced by the strong negative linear relationship between Art Market Research and Gold Futures (p = 0.011), which suggests that gold futures performance can systematically predict inverse movements in art markets. Champagne investments may offer diversification advantages in luxury-focused portfolios, as evidenced by the Liv-ex Champagne 50 index's significant negative linear relationship with the S&P Global Luxury Index (p = 0.046). This relationship suggests that luxury equity performance can forecast counter-cyclical movements in the champagne market.

These results show that some collectibles have statistically significant predictive relationships with digital assets, luxury sector indices, and commodity markets, even though systematic relationships do not exist across all categories. While counter-cyclical relationships between art-gold and champagne-luxury stocks suggest possible hedging characteristics, the emergence of Bitcoin correlations between luxury watches and vintage Ferrari suggests changing market dynamics.

The hypothesis is partially supported based on evidence of selective linear linkages between certain collectibles and broader financial market indicators. The discovery of statistically significant predictive relationships suggests that collectibles markets show selective sensitivity patterns that differ substantially across categories and market indicators, rather than being completely independent from larger financial forces, even though systematic relationships do not exist across all categories.

6.5 Portfolio Construction Implications

The systematic independence of luxury collectibles from both their manufacturer stocks and broader financial markets creates compelling opportunities for portfolio construction and risk management. Our empirical findings demonstrate that collectibles can serve as genuine diversification tools rather than mere luxury consumption items, offering sophisticated investors access to uncorrelated return streams with distinctive risk-return profiles.

6.5.1 Risk-Adjusted Performance Excellence

Several collectible categories demonstrated exceptional risk-adjusted performance that surpassed traditional asset classes during the study period. The Liv-ex Champagne 50 achieved the highest Sharpe ratio among all collectibles at 1.929, combining an 11.24% CAGR with remarkably low volatility of 5.04%. Similarly, Hermès handbags showed outstanding efficiency, with the Kelly model recording a Sharpe ratio of 2.006 and the Constance displaying minimal volatility of 3.69%.

These performance characteristics suggest that selective collectible allocation can enhance portfolio efficiency through superior risk-adjusted returns. The combination of positive returns with low correlation to traditional assets creates opportunities for portfolio optimization that extend beyond simple diversification benefits to include alpha generation potential.

The exceptional performance of rare whisky, particularly the Brora Index achieving 494.82% total returns (19.52% CAGR), demonstrates that certain collectibles can deliver substantial absolute returns while maintaining reasonable risk profiles. This performance profile positions select collectibles as potential core holdings rather than peripheral alternative allocations in sophisticated investment portfolios.

6.5.2 Market Independence and Diversification Benefits

The comprehensive absence of significant correlations between collectibles and major financial market indices validates their role as true alternative assets. With correlation coefficients consistently remaining below ±0.20 against all tested benchmarks, collectibles offer genuine portfolio diversification that maintains effectiveness across different market conditions.

This independence is particularly valuable during periods of financial market stress, when traditional asset correlations tend to increase. The systematic decoupling from both equity markets and their manufacturer stocks ensures that collectibles maintain their diversification benefits even when brand equity and corporate performance face headwinds.

The selective counter-cyclical relationships observed between certain collectibles and traditional assets further enhance their portfolio value. Art's negative correlation with gold futures (p = 0.011) and champagne's inverse relationship with luxury stock indices (p = 0.046) suggest that strategic collectible allocation can provide hedging characteristics that complement traditional risk management strategies.

6.5.3 Strategic Investment Framework

Based on our findings, optimal collectible allocation requires category-specific strategies that account for varying risk-return profiles and market dynamics. Conservative investors might favor champagne and luxury handbags for their combination of stability and appreciation potential, while growth-oriented portfolios could benefit from whisky and vintage automobiles despite their higher volatility.

The emergence of selective correlations with digital assets, particularly Bitcoin, suggests that collectibles allocation should also consider broader alternative asset strategies. The integration of traditional collectibles with digital asset exposure could provide enhanced diversification while capturing emerging market relationships that reflect evolving investor preferences and technological infrastructure.

Professional portfolio management should approach collectibles with the same analytical rigor applied to traditional asset classes, including systematic due diligence, category expertise, and ongoing performance monitoring. The heterogeneity of returns within and across collectible categories demands sophisticated selection criteria that extend beyond aesthetic appreciation to include quantitative risk-return assessment.

6.6 Future Research Directions

Our systematic analysis opens several promising avenues for expanding understanding of collectibles as alternative investments. These research directions address both methodological improvements and market developments that could enhance the practical application of collectibles in institutional and retail portfolio management.

6.6.1 Market Evolution and Institutional Adoption

The growing institutionalization of collectibles markets, evidenced by the development of professional indices, specialized investment platforms, and increasing family office participation, creates opportunities for research into how institutional adoption affects price discovery, liquidity, and volatility patterns. Future studies could examine whether increasing institutional participation alters the fundamental independence characteristics that make collectibles attractive for diversification.

Additionally, the emergence of fractional ownership platforms and blockchain-based authentication systems represents a structural shift that could democratize collectibles investing while potentially affecting traditional valuation mechanisms. Research into how technological infrastructure changes impact collectible market dynamics would provide valuable insights for both academic understanding and practical application.

The development of Exchange-Traded Funds (ETFs) focused on collectible indices presents another institutional innovation worthy of investigation. Such vehicles could enhance liquidity and accessibility while potentially altering the risk-return characteristics that make individual collectibles attractive to sophisticated investors.

6.6.2 Data Infrastructure and Geographic Expansion

Our study identified significant data availability constraints, particularly for cognac markets and certain vintage watch categories. Future research should prioritize the development of comprehensive indices for underrepresented collectible categories and geographic markets, particularly Asian collecting traditions that may exhibit different risk-return characteristics and correlation patterns.

The integration of alternative data sources, including Google Trends analysis, social media sentiment, and auction house private sales data, could enhance predictive capabilities and provide earlier indicators of market developments. Machine learning approaches applied to these expanded datasets might reveal more sophisticated patterns in collectible valuation and market timing opportunities.

Cross-cultural analysis of collecting behaviors and valuation mechanisms could illuminate whether the independence characteristics observed in Western markets extend to Asian, Middle Eastern, and emerging market contexts. Such research would be particularly valuable as global wealth distribution continues to shift toward non-Western regions with distinct cultural traditions and aesthetic preferences.

6.7 Final Assessment

This comprehensive decade-long analysis validates luxury collectibles as legitimate alternative investment vehicles that offer genuine portfolio diversification benefits through systematic independence from traditional financial markets. The consistent absence of significant correlations between collectibles and their manufacturer stocks challenges conventional wisdom about brand equity spillover effects, while the selective relationships with digital assets and commodities reveal evolving market dynamics that sophisticated investors can potentially exploit.

The exceptional risk-adjusted performance demonstrated by categories such as champagne, rare whisky, and luxury handbags positions these assets as more than speculative investments or lifestyle purchases. Their combination of positive returns, low volatility, and statistical independence creates opportunities for portfolio optimization that extend traditional mean-variance frameworks into alternative asset allocation strategies.

However, the significant performance dispersion within and across collectible categories underscores the importance of systematic analysis and due diligence in collectibles allocation. While certain categories delivered exceptional returns with minimal risk, others demonstrated the speculative characteristics typically associated with passion investments. This heterogeneity suggests that successful collectibles investing requires the same analytical rigor applied to traditional asset classes, combined with deep understanding of category-specific market dynamics.

The emergence of selective correlations with Bitcoin and other digital assets indicates that collectibles markets are not immune to broader technological and cultural shifts affecting investment preferences. These evolving relationships suggest that collectibles allocation strategies must remain adaptive to changing market conditions while maintaining focus on the fundamental independence characteristics that provide diversification value.

Looking forward, the increasing institutionalization of collectibles markets, enhanced by technological infrastructure improvements and regulatory development, positions these assets for broader adoption within sophisticated portfolio management frameworks. The evidence presented in this study supports the integration of systematically selected collectibles into diversified investment portfolios, not as speculative allocations, but as core components of modern alternative investment strategies designed to enhance risk-adjusted returns while maintaining portfolio resilience across varying market conditions.

The validation of collectibles as genuine alternative assets with quantifiable diversification benefits represents a significant contribution to both academic literature and practical investment management. As traditional asset class correlations continue to increase during periods of market stress, the systematic independence demonstrated by luxury collectibles provides a valuable tool for portfolio construction in an increasingly interconnected global financial system.

References

  1. Angrist, J.D. and Pischke, J-S. (2009) Mostly Harmless Econometrics: An Empiricist's Companion. Princeton: Princeton University Press.
  2. Antwerp World Diamond Centre (2024) Market Reports. Available at: https://www.awdc.be/en/market-information (Accessed: 27 July 2024).
  3. Art Basel (2022) The Importance of Authenticity in Art Valuation. Available at: https://www.artbasel.com/authenticity (Accessed: 19 Mar. 2023).
  4. Art Market Monitor (2022) The Influence of Artist Reputation on Market Value. Available at: https://www.artmarketmonitor.com/influence-of-reputation (Accessed: 19 Mar. 2023).
  5. Art Market Research (2023) All Art Family. Available at: https://www.artmarketresearch.com/all-art-family/ (Accessed: 18 August 2024).
  6. Art Market Research (2023) Methodology. Available at: https://www.artmarketresearch.com/methodology/ (Accessed: 30 May 2025).
  7. Artcurial (2024) Artcurial Auction House. Available at: https://www.artcurial.com/en (Accessed: 27 July 2024).
  8. Artnet (2024) Auction Houses. Available at: https://www.artnet.com/auction-houses/ (Accessed: 27 July 2024).
  9. Artnet News (2024) Rembrandt $180 Million Deal with Rijksmuseum. Available at: https://news.artnet.com/art-world/rembrandt-180-million-deal-rijksmuseum-334495 (Accessed: 27 July 2024).
  10. Artsy (2024) Pablo Picasso Auction Results. Available at: https://www.artsy.net/artist/pablo-picasso/auction-results (Accessed: 27 July 2024).
  11. Artprice (2024a) Global Art Market in H1 2022 by Artprice.com. Available at: https://www.artprice.com/artprice-reports/global-art-market-in-h1-2022-by-artprice-com/the-art-market-returns-to-strong-growth-in-the-west (Accessed: 27 July 2024).
  12. Artprice (2024b) The Artprice100 Index Was Up 1.55% in 2023. Available at: https://www.artprice.com/artmarketinsight/the-artprice100-index-was-up-1-55-in-2023 (Accessed: 27 July 2024).
  13. AXA Investment Managers (2025) What Do Handbags Have in Common with Volatile Markets? Available at: https://select.axa-im.com/insights-auto/thought-leadership/what-do-handbags-have-common-volatile-markets (Accessed: 20 July 2025).
  14. Bailey, D.H. and López de Prado, M. (2012) 'The Sharpe Ratio Efficient Frontier', Journal of Risk, 15(2), pp. 13-44.
  15. Bain & Company (2024) Diamond Market Insights and Forecast. Available at: https://www.bain.com/global-diamond-market-insights (Accessed: 18 August 2024).
  16. Bentzen, J., Leth-Sørensen, S. and Smith, V. (2002) 'Prices of French Icon Wines and the Business Cycle: Empirical Evidence from Danish Wine Auctions', Centre for International Economic Studies, Discussion Paper, No. 0224.
  17. Beyler, E. (2022) 'Pourquoi le marché des montres d'occasion s'emballe', Les Echos.
  18. Bloomberg (2022) Hermès Kelly Bag Fetches Record Price at Sotheby's Auction. Available at: https://www.bloomberg.com/news/articles/2022-09-30/hermes-kelly-bag-fetches-record-price-at-sotheby-s-auction (Accessed: 27 July 2024).
  19. Bloomberg (2023) 'Rolex, Patek Investment Beats S&P Gains Over Five Years'.
  20. Bloomberg (2024) Market Trends and Gold Price Analysis. Available at: https://www.bloomberg.com/gold-market-trends (Accessed: 18 August 2024).
  21. Bonhams (2024a) Market Analysis for Classic Cars. Available at: https://www.bonhams.com/market-analysis-classic-cars (Accessed: 18 August 2024).
  22. Bonhams (2024b) Market Insights for Classic Cars. Available at: https://www.bonhams.com/classic-car-market-insights (Accessed: 18 August 2024).
  23. Bonhams (2024c) Bonhams Auction House. Available at: https://www.bonhams.com/ (Accessed: 27 July 2024).
  24. Business of Fashion (2024) The Rarity and Value of Hermès Handbags. Available at: https://www.businessoffashion.com/articles/luxury/hermes-bag-rarity (Accessed: 18 August 2024).
  25. Cardebat, J.-M. (2017) Économie du vin. Paris: La Découverte.
  26. Cardebat, J.-M. and Jiao, L. (2017) 'The long-term financial drivers of fine wine prices: The role of emerging markets', The Quarterly Review of Economics and Finance, 65, pp. 163-177.
  27. CEIC Data (2024) Japan Market Capitalization. Available at: https://www.ceicdata.com/en/indicator/japan/market-capitalization (Accessed: 27 July 2024).
  28. Chambers, D.R., Anson, M.J.P., Black, K.H., Kazemi, H.B. and CAIA Association (2020) Alternative Investments: CAIA Level I. 4th edn. Hoboken, NJ: Wiley.
  29. Christie's (2022) Provenance and Rarity in the Art Market. Available at: https://www.christies.com/provenance-rarity (Accessed: 19 Mar. 2023).
  30. Christie's (2024a) Auction Trends for Hermès Handbags. Available at: https://www.christies.com/features/hermes-handbags-auction-trends (Accessed: 18 August 2024).
  31. Christie's (2024b) Sneaker Market Trends and Auction Results. Available at: https://www.christies.com/sneaker-market-trends (Accessed: 18 August 2024).
  32. Christie's (2024c) Handbags Online: The Hong Kong Edit. Available at: https://www.christies.com/auction/handbags-online-the-hong-kong-edit-23213-hgk (Accessed: 27 July 2024).
  33. Christie's (2024d) Handbags: Mini Kelly Collecting Guide. Available at: https://www.christies.com/en/stories/handbags-mini-kelly-collecting-guide-92be204d042546208511d885eda97898 (Accessed: 27 July 2024).
  34. Christie's (2024e) Hermès Handbags: Collecting Guide. Available at: https://www.christies.com/en/stories/hermes-handbags-collecting-guide-e7f2b17272e144c98136ee3946005b8d (Accessed: 27 July 2024).
  35. Christie's (2024f) Leonardo and Post-War Results in New York. Available at: https://www.christies.com/en/stories/leonardo-and-post-war-results-new-york-ad70dd5889e64989a76c94e4358c760d (Accessed: 27 July 2024).
  36. Chrono24 (2022) 8 choses à savoir avant d'investir dans les montres. Available at: https://www.chrono24.fr/magazine/8-choses-a-savoir-avant-dinvestir-dans-les-montres-p_104566/ (Accessed: 19 Mar. 2023).
  37. Chrono24 (2024) The Top 10 Watch Brands of All Time. Available at: https://www.chrono24.com/magazine/the-top-10-watch-brands-of-all-time-p_107724/ (Accessed: 27 July 2024).
  38. Classic Car Restoration (2024a) Condition and Provenance in Classic Cars. Available at: https://www.classiccarrestoration.com/condition-provenance (Accessed: 18 August 2024).
  39. Classic Car Restoration (2024b) The Importance of Condition and Provenance. Available at: https://www.classiccarrestoration.com/condition-provenance (Accessed: 18 August 2024).
  40. Classic (2024) Aston Martin. Available at: https://www.classic.com/m/aston-martin/ (Accessed: 27 July 2024).
  41. Classic.com (2024a) Aston Martin DB4. Available at: https://www.classic.com/m/aston-martin/db4/ (Accessed: 29 July 2024).
  42. Classic.com (2024b) Aston Martin Vantage. Available at: https://www.classic.com/m/aston-martin/vantage/ (Accessed: 29 July 2024).
  43. Cleveland Federal Reserve (2010) Are Some Prices in the CPI More Forward-Looking Than Others? We Think So. Available at: https://www.clevelandfed.org/publications/economic-commentary/ec-201002-are-some-prices-in-the-cpi-more-forward-looking-than-others-we-think-so (Accessed: 27 July 2024).
  44. Collector Square (2024a) Hermès Birkin 25 cm Handbag in Green Yucca Epsom Leather. Available at: https://www.collectorsquare.com/en/bags/hermes/birkin/herbes-birkin-25-cm-handbag-in-green-yucca-epsom-leather-405311.html (Accessed: 27 July 2024).
  45. Collector Square (2024b) Hermès Constance Nigel Peake Shoulder Bag in Multicolor Swift Leather. Available at: https://www.collectorsquare.com/en/bags/hermes/constance/hermes-constance-nigel-peake-shoulder-bag-in-multicolor-swift-leather-365015.html (Accessed: 27 July 2024).
  46. Collector Square (2024) Hermès Kelly Plastic Handbag in Transparent Vinyl. Available at: https://www.collectorsquare.com/en/bags/hermes/kelly/hermes-kelly-plastic-handbag-in-transparent-vinyl-402536.html (Accessed: 27 July 2024).
  47. Complex (2024) The Air Jordan Phenomenon. Available at: https://www.complex.com/air-jordan-phenomenon (Accessed: 18 August 2024).
  48. Crenn, C., Demossier, M. and Pétric, B.-M. (2021) 'Anthropologie du vin : un objet singulier, entre subjectivation et circulation', Ethnologie française, 51(3), pp. 491-501. DOI: 10.3917/ethn.213.0491. Available at: https://www.cairn.info/revue-ethnologie-francaise-2021-3-page-491.htm (Accessed: 18 August 2024).
  49. CultX (2024) Indices. Available at: https://www.cultx.com/indices (Accessed: 27 July 2024).
  50. De Beers Group (2023) Global Diamond Market Report. Available at: https://www.debeersgroup.com/diamond-market-report (Accessed: 18 August 2024).
  51. Di Vittorio, A. and Ginsburgh, V. (1996) 'Des enchères comme révélateurs du classement des vins. Les grands crus du Haut-Médoc', Journal de la Société Statistique de Paris, 137(2), pp. 19-49.
  52. Dimson, E., Rousseau, P.L. and Spaenjers, C. (2015) 'The Price of Wine', Journal of Financial Economics, 118(2), pp. 431-449. Available at: https://ssrn.com/abstract=2321573 or http://dx.doi.org/10.2139/ssrn.2321573.
  53. Dupreelle, P., et al. (2023) Art Market Trends and Economic Impact. Available at: https://www.bcg.com/publications/2023/art-market-trends (Accessed: 19 Mar. 2023).
  54. Dupreelle, P., et al. (2023) Luxury Watch Market Trends. Available at: https://www.bcg.com/publications/2023/luxury-watch-market-trends (Accessed: 19 Mar. 2023).
  55. Exchange Rates (2024) CNY/USD Spot Exchange Rates History 2013. Available at: https://www.exchangerates.org.uk/CNY-USD-spot-exchange-rates-history-2013.html (Accessed: 27 July 2024).
  56. Exchange Rates (2024) EUR/USD Spot Exchange Rates History 2013. Available at: https://www.exchangerates.org.uk/EUR-USD-spot-exchange-rates-history-2013.html (Accessed: 27 July 2024).
  57. Exchange Rates (2024) GBP/USD Spot Exchange Rates History 2013. Available at: https://www.exchangerates.org.uk/GBP-USD-spot-exchange-rates-history-2013.html (Accessed: 27 July 2024).
  58. Exchange Rates (2024) SEK/USD Spot Exchange Rates History 2014. Available at: https://www.exchangerates.org.uk/SEK-USD-spot-exchange-rates-history-2014.html (Accessed: 27 July 2024).
  59. Federal Reserve Bank of Atlanta (2024) Sticky Price Consumer Price Index less Food and Energy (CORESTICKM159SFRBATL). Available at: https://fred.stlouisfed.org/series/CORESTICKM159SFRBATL (Accessed: 27 June 2024).
  60. Federal Reserve Bank of St. Louis (2024) Consumer Price Index (CPI) for All Urban Consumers: All Items. Available at: https://fred.stlouisfed.org/graph/?g=rocU#:~:text=The%20%22Consumer%20Price%20Index%20for,energy%20have%20very%20volatile%20prices (Accessed: 27 July 2024).
  61. Federal Reserve Bank of St. Louis (2024) Consumer Price Index for All Urban Consumers: All Items Less Food and Energy (CPILFESL). Available at: https://fred.stlouisfed.org/series/CPILFESL (Accessed: 27 July 2024).
  62. Fédération de l'industrie horlogère suisse FH (2023a) Horlogerie suisse et mondiale en 2021. Available at: https://www.fhs.swiss/eng/statistics.html (Accessed: 19 Mar. 2023).
  63. Fédération de l'industrie horlogère suisse FH (2023b) Swiss watch exports January-December 2022. Available at: https://www.fhs.swiss/eng/statistics.html (Accessed: 19 Mar. 2023).
  64. Fédération de l'industrie horlogère suisse FH (2023c) World distribution of Swiss watch exports January-December 2022. Available at: https://www.fhs.swiss/eng/statistics.html (Accessed: 19 Mar. 2023).
  65. Fédération de l'industrie horlogère suisse FH (2023d) Swiss watch exports by region January-December 2022. Available at: https://www.fhs.swiss/eng/statistics.html (Accessed: 19 Mar. 2023).
  66. Fogarty, J. (2010) 'Wine Investment and Portfolio Diversification Gains', Journal of Wine Economics, 5(1), pp. 119-131. DOI: 10.1017/S1931436100001401. Available at: https://www.cambridge.org/core/journals/journal-of-wine-economics/article/abs/wine-investment-and-portfolio-diversification-gains/672DBAC0B65FA4E3108970EF5504AD6C (Accessed: 18 August 2024).
  67. Forbes (2024) Investing in Classic and Collectible Sneakers. Available at: https://www.forbes.com/investing-classic-collectible-sneakers (Accessed: 18 August 2024).
  68. Forbes (2024) Investing in Classic Cars: Ferrari, Aston Martin, Porsche. Available at: https://www.forbes.com/investing-classic-cars-ferrari-aston-martin-porsche (Accessed: 18 August 2024).
  69. Forbes (2024) Investing in Luxury: The Case of Hermès Handbags. Available at: https://www.forbes.com/sites/investing-hermes-handbags (Accessed: 18 August 2024).
  70. Forbes (2024) Investment Opportunities in Classic Cars. Available at: https://www.forbes.com/sites/investing-in-classic-cars (Accessed: 18 August 2024).
  71. Forbes (2024) Investment Opportunities in Diamonds. Available at: https://www.forbes.com/sites/investing-in-diamonds (Accessed: 18 August 2024).
  72. Forbes (2024) Investment Strategies for Gold. Available at: https://www.forbes.com/investing-in-gold-strategies (Accessed: 18 August 2024).
  73. Forbes (2016) Breaking News: Patek Philippe Ref. 1518 in Steel is the World's Most Expensive Watch at $11 Million. Available at: https://www.forbes.com/sites/carolbesler/2016/11/12/breaking-news-patek-philippe-ref-1518-in-steel-is-the-worlds-most-expensive-watch-at-11-million/#6a63dad57f44 (Accessed: 27 July 2024).
  74. Galí, J. (2015) Monetary Policy, Inflation, and the Business Cycle: An Introduction to the New Keynesian Framework and Its Applications. 2nd edn. Princeton: Princeton University Press.
  75. GIA (Gemological Institute of America) (2024) Rarity and Value of Colored Diamonds. Available at: https://www.gia.edu/colored-diamonds-value (Accessed: 18 August 2024).
  76. GJEPC (2024) Diamond Prices Poised for a Rebound in 2024. Available at: https://gjepc.org/solitaire/diamond-prices-poised-for-a-rebound-in-2024/ (Accessed: 27 July 2024).
  77. Goldman Sachs (2024) Gold as an Investment: Historical Performance and Future Outlook. Available at: https://www.goldmansachs.com/gold-investment-report (Accessed: 18 August 2024).
  78. Gooding & Co (2024a) Aston Martin Classics: Investment Trends. Available at: https://www.goodingco.com/aston-martin-classics-investment-trends (Accessed: 18 August 2024).
  79. Gooding & Co (2024b) Investment Trends in Classic Cars. Available at: https://www.goodingco.com/investment-trends-classic-cars (Accessed: 18 August 2024).
  80. Gooding & Co (2024c) Gooding & Co Auction House. Available at: https://www.goodingco.com/ (Accessed: 27 July 2024).
  81. Hagerty (2023a) Classic Car Market Report. Available at: https://www.hagerty.com/classic-car-market-report (Accessed: 18 August 2024).
  82. Hagerty (2023b) Porsche Classic Car Insights. Available at: https://www.hagerty.com/porsche-classic-car-insights (Accessed: 18 August 2024).
  83. Hillier, D. (2024) Corporate Finance. 5th edn. London: McGraw-Hill.
  84. Hodinkee (2024a) Double-Signed Patek Philippe Ref. 2523 Sells for HKD 70,175,000. Available at: https://www.hodinkee.com/articles/double-signed-patek-philippe-ref-2523-sells-for-hkd-70175000 (Accessed: 27 July 2024).
  85. Hodinkee (2024b) Double-Signed Patek Philippe Ref. 2523 Sells for HKD 70,175,000. Available at: https://www.hodinkee.com/articles/double-signed-patek-philippe-ref-2523-sells-for-hkd-70175000 (Accessed: 27 July 2024).
  86. HRD Antwerp (2024) The Importance of Diamond Certification. Available at: https://www.hrdantwerp.com/diamond-certification (Accessed: 18 August 2024).
  87. IDEX Online (2024) Diamond Prices Index. Available at: http://www.idexonline.com/diamond_prices_index (Accessed: 27 July 2024).
  88. Investopedia (2023) Correlation. Available at: https://www.investopedia.com/terms/c/correlation.asp (Accessed: 31 July 2024).
  89. Investopedia (2024a) Sharpe Ratio. Available at: https://www.investopedia.com/terms/s/sharperatio.asp (Accessed: 31 July 2024).
  90. Investopedia (2024b) Volatility. Available at: https://www.investopedia.com/terms/v/volatility.asp (Accessed: 31 July 2024).
  91. Israeli Diamond Institute (2024) IDEX: Polished Diamond Prices. Available at: https://en.israelidiamond.co.il/news/world/idex-polished-diamond-prices/ (Accessed: 27 July 2024).
  92. Jaeger, E. (1981) 'To Save or Savor: The Rate of Return to Storing Wine', Journal of Political Economy, 89(3), pp. 584-592. DOI: https://doi.org/10.1086/260988.
  93. K500 (2024) The Index. Available at: https://k500.com/the-index (Accessed: 27 July 2024).
  94. Kitco (2024) Gold Purity and Market Value. Available at: https://www.kitco.com/gold-purity-value (Accessed: 18 August 2024).
  95. Knight Frank (2018) What is the Knight Frank Luxury Investment Index? The Wealth Report 2018 [Video online]. Available at: https://www.youtube.com/watch?v=iwS3p63kjBM (Accessed: 28 April 2019).
  96. Knight Frank (2019a) Luxury Investment Index: Coloured Gemstones Special 2019. Available at: https://content.knightfrank.com/research/540/documents/en/knight-frank-luxury-investment-index-coloured-gemstones-special-q1-2019-6464.pdf (Accessed: 1 August 2019).
  97. Knight Frank (2019b) The Wealth Report. Available at: https://content.knightfrank.com/resources/knightfrank.com/wealthreport/2019/the-wealth-report-2019.pdf (Accessed: 28 April 2019).
  98. Knight Frank (2020) Knight Frank Luxury Investment Update: Handbags [Online]. Available at: https://www.knightfrank.com/research/article/2020-06-29-knight-frank-luxury-investment-update-handbags (Accessed: 27 July 2024).
  99. Knight Frank (2021) Luxury Investments: Past, Present and Future. Available at: https://www.knightfrank.com/research/article/2021-06-28-luxury-investments-past-present-and-future (Accessed: 18 August 2024).
  100. Knight Frank (2023a) Are Whisky and Handbags Still a Wise Investment? Available at: https://www.knightfrank.com/research/article/2023-08-30-are-whisky-and-handbags-still-a-wise-investment (Accessed: 27 July 2024).
  101. Knight Frank (2023b) Are Whisky and Handbags Still a Wise Investment? [Online]. Available at: https://www.knightfrank.com/research/article/2023-08-30-are-whisky-and-handbags-still-a-wise-investment (Accessed: 27 July 2024).
  102. KRIS DIAMONDS (2024) Diamond Index. Available at: https://www.krisdiamonds.be/diamond-index-2/ (Accessed: 27 July 2024).
  103. KRIS DIAMONDS (2024) Diamond Index. Available at: https://www.krisdiamonds.be/diamond-index-2/ (Accessed: 27 July 2024).
  104. Kronos 360 (2022a) Bilan marché 2022 : les montres modernes baissent, les montres vintage ont la cote. Available at: https://www.kronos360.com/fr/blog/351-bilan-marche-2022-les-montres-modernes-baissent-les-montres-vintage-ont-la-cote.html (Accessed: 19 Mar. 2023).
  105. Kronos 360 (2022b) Bilan marché 2022: les montres modernes baissent, les montres vintage ont la cote. Available at: https://www.kronos360.com/fr/blog/351-bilan-marche-2022-les-montres-modernes-baissent-les-montres-vintage-ont-la-cote.html (Accessed: 19 Mar. 2023).
  106. Le Monde (2022) 'Les investisseurs se ruent sur le whisky écossais'. Le Monde, 9 December [Online]. Available at: https://www.lemonde.fr/economie/article/2022/12/09/les-investisseurs-se-ruent-sur-le-whisky-ecossais_6153707_3234.html (Accessed: 18 August 2024).
  107. Leeper, E.M. (2010) Fiscal Policy, Public Debt and the Term Structure of Interest Rates. Cambridge, MA: National Bureau of Economic Research.
  108. Lendopolis (2021) Investir dans les montres : Guide d'investissement. Available at: https://blog.lendopolis.com/epargne/investir-montres-guide-investissement/ (Accessed: 19 Mar. 2023).
  109. Liv-ex (2024a) Indices. Available at: https://www.liv-ex.com/news-insights/indices/ (Accessed: 27 July 2024).
  110. Liv-ex (2024b) Liv-ex. Available at: https://www.liv-ex.com/ (Accessed: 27 July 2024).
  111. Luxe Consulting (2024) Investment Potential of Iconic Handbags. Available at: https://www.luxeconsulting.com/iconic-handbags-investment (Accessed: 18 August 2024).
  112. Masset, P. and Henderson, C. (2010) 'Wine as an Alternative Asset Class', Journal of Wine Economics, 5(1), pp. 87-118. DOI: 10.1017/S1931436100001395.
  113. Masset, P. and Weisskopf, J.-P. (2016) 'A study of the performance of fine wine on the Swiss market', International Journal of Entrepreneurship and Small Business, 29(4), pp. 566-582. Available at: https://arodes.hes-so.ch/record/1906?ln=fr (Accessed: 18 August 2024).
  114. McFadzean, D., Crawford, S., Hartop, W., Coates, S., Jones, G. and Illenseer, G. (2022) Noble & Co Whisky Intelligence Report 2022 [Online]. Noble & Co. Available at: https://nobleandcompany.com/whisky-intelligence-2022/ (Accessed: 20 March 2023).
  115. McKinsey & Company (2023) The Global Luxury Handbag Market Report. Available at: https://www.mckinsey.com/industries/luxury/our-insights (Accessed: 18 August 2024).
  116. Mining Review Africa (2024) Diamond Prices Charging Towards an All-Time High. Available at: https://www.miningreview.com/diamonds-gemstones/diamond-prices-charging-towards-an-all-time-high/ (Accessed: 27 July 2024).
  117. Müller, P. (2022) Morgan Stanley Watch Industry Report 2022. Available at: https://watchesbysjx.com/2022/03/morgan-stanley-watch-industry-report-2022.html (Accessed: 19 Mar. 2023).
  118. OIV (2024) Country Report. Available at: https://www.oiv.int/what-we-do/country-report?oiv (Accessed: 27 July 2024).
  119. Phillips (2015) Patek Philippe, Lot 16. Available at: https://www.phillips.com/detail/PATEK-PHILIPPE/CH080415/16 (Accessed: 27 July 2024).
  120. Phillips (2016) Patek Philippe, Lot 38. Available at: https://www.phillips.com/detail/PATEK-PHILIPPE/CH080216/38 (Accessed: 27 July 2024).
  121. Phillips (2021a) Patek Philippe, Lot 1T. Available at: https://www.phillips.com/detail/patek-philippe/NY080121/1T (Accessed: 27 July 2024).
  122. Phillips (2021b) Patek Philippe, Lot 33. Available at: https://www.phillips.com/detail/patek-philippe/CH080121/33 (Accessed: 27 July 2024).
  123. Phillips (2023) Auction Trends and Art Valuation. Available at: https://www.phillips.com/auction-trends (Accessed: 19 Mar. 2023).
  124. Phillips (2024a) London Buyers Guide 2024. Available at: https://content.phillips.com/docs/forms/London_Buyers_Guide_2024_04_01.pdf (Accessed: 27 July 2024).
  125. Phillips (2024b) Paul Newman's Paul Newman Rolex Daytona Sets World Record, Fetches $17.8 Million. Available at: https://www.phillips.com/article/18461746/paul-newman-s-paul-newman-rolex-daytona-sets-world-record-fetches-17-8-million (Accessed: 27 July 2024).
  126. Public (2024a) Most Expensive & Valuable Hermès Birkin Bags. Available at: https://public.com/learn/most-expensive-valuable-hermes-birkin-bags (Accessed: 27 July 2024).
  127. Public (2024b) Most Expensive & Valuable Hermès Birkin Bags. Available at: https://public.com/learn/most-expensive-valuable-hermes-birkin-bags?wpsrc=Organic+Search&wpsn=www.google.com (Accessed: 27 July 2024).
  128. Rapaport (2024) Investment Trends in High-Quality Diamonds. Available at: https://www.rapaport.com/investment-trends-diamonds (Accessed: 18 August 2024).
  129. Rare Whisky 101 (2022) 2020 Full Year Report Including First Half of 2021 [Online]. Available at: https://www.rarewhisky101.com/indices/intelligence (Accessed: 20 March 2023).
  130. Rare Whisky 101 (2024a) Brora OB Index. Available at: https://www.rarewhisky101.com/indices/distillery-specific-indices/brora_ob_index (Accessed: 27 July 2024).
  131. Rare Whisky 101 (2024b) Market Performance Indices: Index Comparison Chart. Available at: https://www.rarewhisky101.com/indices/market-performance-indices/index-comparison-chart (Accessed: 27 July 2024).
  132. Rare Whisky 101 (2024c) Rare Whisky 100 Index. Available at: https://www.rarewhisky101.com/indices/market-performance-indices/rare_whisky_100_index (Accessed: 27 July 2024).
  133. Rare Whisky 101 (2024d) Rare Whisky 101. Available at: https://www.rarewhisky101.com/ (Accessed: 27 July 2024).
  134. Rare Whisky 101 (2024e) RW Apex Indices. Available at: https://www.rarewhisky101.com/indices/market-performance-indices/rw-apex-indices (Accessed: 27 July 2024).
  135. Rebag (2023a) Luxury Handbags Trends and Value for 2023. Available at: https://fashionista.com/2023/12/rebag-luxury-handbags-trends-value-2023 (Accessed: 2 August 2024).
  136. Rebag (2023b) Luxury Handbags Trends and Value for 2023. Fashionista. Available at: https://fashionista.com/2023/12/rebag-luxury-handbags-trends-value-2023 (Accessed: 2 August 2024).
  137. RM Sotheby’s (2024a) Ferrari Classic Cars Market Report. Available at: https://www.rmsothebys.com/ferrari-classic-cars-market-report (Accessed: 18 August 2024).
  138. RM Sotheby’s (2024b) Rarity and Value in Classic Cars. Available at: https://www.rmsothebys.com/rarity-value-classic-cars (Accessed: 18 August 2024).
  139. RM Sotheby's (2024c) RM Sotheby's Auction House. Available at: https://rmsothebys.com/ (Accessed: 27 July 2024).
  140. Robb Report (2024) This $31M Patek Philippe Is Now the Most Expensive Watch in the World. Available at: https://robbreport.com/style/watch-collector/this-31m-patek-philippe-is-now-the-most-expensive-watch-in-the-world-2879669/ (Accessed: 27 July 2024).
  141. Sanning, L.W., Shaffer, S. and Sharratt, J.M. (2012) 'Bordeaux Wine as a Financial Investment', Journal of Wine Economics, 3(1), pp. 51-71. DOI: 10.1017/S1931436100000559. Available at: https://www.cambridge.org/core/journals/journal-of-wine-economics/article/abs/bordeaux-wine-as-a-financial-investment/34CF4DD2D645CAE56CE7E0B14228FB4D (Accessed: 18 August 2024).
  142. Schrieberg, F. (2019) '$16.7 million whisky collection wins Guinness World Record', Forbes, 22 November. Available at: https://www.forbes.com/sites/felipeschrieberg/2019/11/22/167-million-whisky-collection-wins-guinness-world-record/?sh=38d8d7d93f26 (Accessed: 2 August 2024).
  143. Sherwood (2024) Ferrari High Profit Margin: New EV Supercar Impact. Available at: https://sherwood.news/business/ferrari-high-profit-margin-new-ev-supercar-impact/?utm_source=chartr&utm_medium=email&utm_campaign=chartr_20240621 (Accessed: 27 July 2024).
  144. Sole Collector (2024) Adidas Classics: Value and Trends. Available at: https://www.solecollector.com/adidas-classics-value-trends (Accessed: 18 August 2024).
  145. Sotheby's (2014) Important Watches GE1404, Lot 345. Available at: https://www.sothebys.com/en/auctions/ecatalogue/2014/important-watches-ge1404/lot.345.html (Accessed: 27 July 2024).
  146. Sotheby's (2021) Important Watches. Available at: https://www.sothebys.com/en/buy/auction/2021/important-watches-4/reference-1518-a-pink-gold-perpetual-calendar (Accessed: 27 July 2024).
  147. Sotheby's (2022) Reference 2499, 2nd Series: A Possibly Unique and. Available at: https://www.sothebys.com/en/buy/auction/2022/the-nevadian-collector/reference-2499-2nd-series-a-possibly-unique-and (Accessed: 27 July 2024).
  148. Sotheby’s (2023) Cultural Significance in Art Valuation. Available at: https://www.sothebys.com/cultural-significance (Accessed: 19 Mar. 2023).
  149. Sotheby's (2024) Banksy’s Artwork Sets New Auction Record. Available at: https://www.sothebys.com/en/buy/auction/2024/banksy-artwork-sets-new-auction-record (Accessed: 27 July 2024).
  150. Statista (2023a) America's Most Wanted Sneaker Brands. Available at: https://www.statista.com/chart/6389/americas-most-wanted-sneaker-brands/ (Accessed: 2 August 2024).
  151. Statista (2023b) Athletic Footwear Sales. Available at: https://www.statista.com/chart/13470/athletic-footwear-sales/ (Accessed: 2 August 2024).
  152. Statista (2023c) Brand Profiler: Sportswear. Available at: https://www.statista.com/chart/28470/brand-profiler-sportswear/ (Accessed: 2 August 2024).
  153. Statista (2023d) Market Share of Sneaker Brands. Available at: https://www.statista.com/chart/30540/market-share-of-sneaker-brands/ (Accessed: 2 August 2024).
  154. Statista (2023e) Most popular sneaker brands in the US. Available at: https://www.statista.com/chart/31830/most-popular-sneaker-brands-in-the-us/ (Accessed: 2 August 2024).
  155. Statista (2023f) Teenagers’ Favorite Clothing and Footwear Brands. Available at: https://www.statista.com/chart/17692/teenagers-favorite-clothing-and-footwear-brands/ (Accessed: 2 August 2024).
  156. StockX (2024a) 8 Charts That Explain Sneakers in 2020. Available at: https://stockx.com/news/8-charts-that-explain-sneakers-in-2020/ (Accessed: 27 July 2024).
  157. StockX (2024b) Air Jordan 1 Price Volatility [Online]. Available at: https://stockx.com/retro-jordans/air-jordan-1/price-volatility (Accessed: 27 July 2024).
  158. StockX (2024c) Nike Highest Bid [Online]. Available at: https://stockx.com/nike/highest-bid (Accessed: 27 July 2024).
  159. StockX (2024d) Nike Classic Sneakers Market Overview. Available at: https://www.stockx.com/nike-classic-sneakers-market-overview (Accessed: 18 August 2024).
  160. Szegedi, J., et al. (2022) Étude Deloitte 2022 sur l’industrie horlogère suisse. Deloitte. Available at: https://www2.deloitte.com/ch/fr/pages/consumer-business/articles/swiss-watch-industry.html (Accessed: 19 Mar. 2023).
  161. The Art Newspaper (2022) Emotional Appeal and Market Value in Art. Available at: https://www.theartnewspaper.com/emotional-appeal (Accessed: 19 Mar. 2023).
  162. The Economist (2017) 'Finance and economics: The passion index. Cars, jewels, wine and watches have been good investments. But the collectables market has drawbacks even for those who can afford it', The Economist, 16 December. Available at: https://www.economist.com/finance-and-economics/2017/12/16/cars-jewels-wine-and-watches-have-been-good-investments (Accessed: 16 August 2024).
  163. The RealReal (2024a) Condition and Authenticity in Sneaker Resale. Available at: https://www.therealreal.com/condition-authenticity-sneaker-resale (Accessed: 18 August 2024).
  164. The RealReal (2024b) Condition and Value of Pre-Owned Hermès Handbags. Available at: https://www.therealreal.com/hermes-handbags-condition-value (Accessed: 18 August 2024).
  165. U.S. Bureau of Labor Statistics (2024a) Consumer Price Index for All Urban Consumers: All Items in U.S. City Average (CPIAUCSL) [Online]. Available at: https://fred.stlouisfed.org/series/CPIAUCSL (Accessed: 4 July 2024).
  166. U.S. Bureau of Labor Statistics (2024b) Consumer Price Index for All Urban Consumers: All Items Less Food and Energy in U.S. City Average (CPILFESL) [Online]. Available at: https://fred.stlouisfed.org/series/CPILFESL (Accessed: 4 July 2024).
  167. Vingtier, A. and Avé, G. (2013) 'Apprendre à déguster le whisky : Quels sont les pays producteurs de whisky ?', La Revue du Vin de France, 12 March. Available at: https://www.larvf.com/apprendre-a-deguster-le-whisky-quels-sont-les-pays-producteurs-de-whisky,13187,4298473.asp (Accessed: 18 August 2024).
  168. Vogue Business (2024) Craftsmanship and Market Value of Hermès Handbags. Available at: https://www.voguebusiness.com/handbags/hermes-craftsmanship (Accessed: 18 August 2024).
  169. Watch Charts (2024a) Brand Indexes. Available at: https://watchcharts.com/watches/brand_indexes (Accessed: 27 July 2024).
  170. Watch Charts (2024b) Price Index. Available at: https://watchcharts.com/watches/price_index (Accessed: 27 July 2024).
  171. Whiskystats (2024a) Index Regions [Online]. Available at: https://www.whiskystats.com/index-monitor/index-regions (Accessed: 2 August 2024).
  172. Whiskystats (2024b) Whisky Index 1 [Online]. Available at: https://www.whiskystats.com/index-monitor/index/1 (Accessed: 2 August 2024).
  173. Wine-Searcher (2024a) Most Expensive Whisky. Available at: https://www.wine-searcher.com/most-expensive-whisky (Accessed: 27 July 2024).
  174. Wine-Searcher (2024b) Most Expensive Wines. Available at: https://www.wine-searcher.com/most-expensive-wines (Accessed: 27 July 2024).
  175. Woodford, M. (2003) Interest and Prices: Foundations of a Theory of Monetary Policy. Princeton: Princeton University Press.
  176. World Gold Council (2024) Gold Demand Trends Report. Available at: https://www.gold.org/gold-demand-trends (Accessed: 18 August 2024).
  177. Yahoo Life (2023) Most Investment-Worthy Designer Handbags to Buy Now. Available at: https://www.yahoo.com/lifestyle/most-investment-worthy-designer-handbags-140000429.html (Accessed: 2 August 2024).
  178. Your Watch Hub (2024) Patek Philippe Ref. 5016A. Available at: https://www.yourwatchhub.com/patek-philippe/patek-philippe-ref-5016a/ (Accessed: 27 July 2024).
  179. Zimnisky, P. (2024) Price Evolution of Lab-grown Diamond 2016-2023 Chart. Available at: https://www.paulzimnisky.com/Price-Evolution-of-Lab-grown-Diamond-2016-2023-Chart (Accessed: 27 July 2024).
  180. Zimnisky, P. (2024) Price Evolution of Lab-grown Diamond 2016-2023 Chart. Available at: https://www.paulzimnisky.com/Price-Evolution-of-Lab-grown-Diamond-2016-2023-Chart (Accessed: 27 July 2024).
  181. Zimnisky, P. (2023) Diamond Market Report 2023. Available at: https://www.paulzimnisky.com/diamond-market-report-2023 (Accessed: 18 August 2024).
  182. Zimnisky, P. (2022) The Impact of Lab-Grown Diamonds on the Natural Diamond Market. Available at: https://www.paulzimnisky.com/impact-of-lab-grown-diamonds (Accessed: 18 August 2024).
  183. Zimnisky, P. (2021) Global Diamond Industry Overview. Available at: https://www.paulzimnisky.com/global-diamond-industry-overview (Accessed: 18 August 2024).
  184. Zimnisky, P. (2020) Diamond Prices and Market Trends. Available at: https://www.paulzimnisky.com/diamond-prices-and-market-trends (Accessed: 18 August 2024).
  185. Zimnisky, P. (2019) The Future of Diamond Mining. Available at: https://www.paulzimnisky.com/future-of-diamond-mining (Accessed: 18 August 2024).
  186. Zimnisky, P. (2018) Diamond Industry Challenges and Opportunities. Available at: https://www.paulzimnisky.com/diamond-industry-challenges-and-opportunities (Accessed: 18 August 2024).
  187. Zimnisky, P. (2017) The Role of Synthetic Diamonds in the Market. Available at: https://www.paulzimnisky.com/role-of-synthetic-diamonds (Accessed: 18 August 2024).
  188. Zimnisky, P. (2016) Diamond Supply and Demand Dynamics. Available at: https://www.paulzimnisky.com/diamond-supply-and-demand-dynamics (Accessed: 18 August 2024).
  189. Zimnisky, P. (2015) The Economics of Diamond Mining. Available at: https://www.paulzimnisky.com/economics-of-diamond-mining (Accessed: 18 August 2024).
  190. Bernstein (2024) LVMH Equity Research Update — Wines & Spirits Contribution. AllianceBernstein Research, March 2024.
  191. Bloomberg (2023) Watch Market Performance Analysis 2012-2022. Bloomberg Financial Services.
  192. Bonhams (2024) Fine & Rare Cognac Auction Results Q1 2024. Available at: https://www.bonhams.com (Accessed: 5 June 2025).
  193. Bourdieu, P. (1984) Distinction: A Social Critique of the Judgement of Taste. Cambridge, MA: Harvard University Press.
  194. Campbell, J.Y., Lo, A.W. and MacKinlay, A.C. (1997) The Econometrics of Financial Markets. Princeton: Princeton University Press.
  195. Chrono Hunter (2024) Luxury Watch Prices Falling as Secondary Rolex Market Declines 8% This Year. Available at: https://chronohunter.com/chronicles/luxury-watch-prices-falling-as-rolex-patek-philippe-secondary-market-prices-dropping-this-year (Accessed: 28 May 2025).
  196. Crenn, C., Demossier, M. and Pétric, B.-M. (2021) 'Anthropologie du vin : un objet singulier, entre subjectivation et circulation', Ethnologie française, 51(3), pp. 491-501. DOI: 10.3917/ethn.213.0491.
  197. Dimson, E. (1979) 'Risk Measurement When Shares Are Subject to Infrequent Trading', Journal of Financial Economics, 7(2), pp. 197-226.
  198. Jobson, J.D. and Korkie, B.M. (1981) 'Performance Hypothesis Testing with the Sharpe and Treynor Measures', Journal of Finance, 36(4), pp. 889-908.
  199. Lo, A.W. (2002) 'The Statistics of Sharpe Ratios', Financial Analysts Journal, 58(4), pp. 36-52.

Appendices

8.1 Collectibles Status

This appendix provides an overview of different collectibles across various investment stages, from their initial launch through latency periods, popularity booms, and eventual maturity as established investment assets.

Overview of Collectibles Across Investment Stages

Collectible Launch Latency Popularity Boom Maturity
Champagne (Dom Pérignon) 1936. First vintage released (Liv-ex, 2024; Sotheby's Wine, 2023). 1936-1980s. Champagne seen as consumable, not collectible (Liv-ex, 2024). 1990s-2010s. Champagne investment rises (Liv-ex, 2024; Knight Frank, 2023). Now. Tracked by Liv-ex Champagne 50 (Liv-ex, 2024; Knight Frank, 2023).
Tag Heuer 1860. Tag Heuer founded; Carrera/Monaco iconic since 1960s (Phillips, 2023; Revolution Watch, 2024) 1960s-1990s. Tag as sports tool watch (Phillips, 2023) 2010s-2020s. Monaco/Carrera now auctioned (Phillips, 2023; Revolution Watch, 2024) Now. Iconic models collectible (Phillips, 2023; Revolution Watch, 2024)
Hermès Kelly 1950s. Originally Sac à dépêches, became Kelly after 1956 (Hermès, n.d.; Vogue Business, 2024). 1950s-1980s. Limited secondary market (Christie's, 2022; Knight Frank, 2019b). 1990s-2000s. Auction activity rises, media interest (Knight Frank, 2020; McKinsey & Company, 2023). Now. Iconic luxury investment (Knight Frank, 2023; McKinsey & Company, 2024; Robb Report, 2024).
Cartier Tank 1917. Cartier Tank launched (Phillips, 2023; Watch Charts, 2024) 1917-1990s. Tank as fashion watch, not collector piece (Phillips, 2023; Knight Frank, 2023) 2010s-2020s. Tank auctions rise (Phillips, 2023; Watch Charts, 2024) Now. Tank is blue-chip collector piece (Phillips, 2023; Watch Charts, 2024)
IWC Big Pilot 1939. Portugieser launched; Big Pilot 1940 (Phillips, 2023; Watch Charts, 2024) 1940-2000s. Niche brand, pilot/tool focus (Phillips, 2023) 2010s-2020s. Big Pilot auctions rise (Phillips, 2023; Watch Charts, 2024) Now. Big Pilot in top modern classics (Phillips, 2023; Watch Charts, 2024)
Jaeger-LeCoultre Reverso 1931. Reverso launched (Phillips, 2023; Revolution Watch, 2024) 1931-1990s. Reverso not strongly collectible (Phillips, 2023) 2010s-2020s. Reverso high demand (Phillips, 2023; Revolution Watch, 2024) Now. Reverso staple at auctions (Phillips, 2023; Revolution Watch, 2024)
Brora Whisky Brora distillery founded 1819; closed 1983 (Rare Whisky 101, 2024; Knight Frank, 2023) 1983-2000s. Brora closed, niche interest (Rare Whisky 101, 2024) 2000s-2020s. Brora bottlings explode in value (Rare Whisky 101, 2024; Knight Frank, 2023) Now. Brora iconic collector whisky (Rare Whisky 101, 2024; Knight Frank, 2023)
Ferrari Classic (Pre-1958) 1950s. Ferrari 250 GT launched (RM Sotheby's, 2024; Hagerty, 2023). 1950s-1980s. Low visibility in collector circles (RM Sotheby's, 2024; Hagerty, 2023). 1990s-2000s. Classic Ferrari market booms (RM Sotheby's, 2024; Knight Frank, 2023). Now. Most prestigious automotive collectible (RM Sotheby's, 2024; Hagerty, 2023).
Porsche 911 1964. Porsche 911 launched (Hagerty, 2023; RM Sotheby's, 2024) 1964-1990s. 911 as sports car, not investment (RM Sotheby's, 2024; Hagerty, 2023) 2000s-2010s. 911 classics rise sharply (Hagerty, 2023; RM Sotheby's, 2024) Now. 911 staple in classic car portfolios (RM Sotheby's, 2024; Hagerty, 2023)
Nike Sneakers 1985. Air Jordan 1 released (Forbes, 2024; Complex, 2024). 1985-2000. Sneakers mostly worn, niche resale (StockX, 2024; Complex, 2024). 2000s-2010s. StockX founded, market boom (StockX, 2024; Sotheby's, 2023; Statista, 2023). Now. Recognized collectible asset (StockX, 2024; Sotheby's, 2023).

This appendix shows the progression of various collectibles from their initial launch through different investment phases to eventual maturity as established asset classes.

Complete Research Document

Luxury Collectibles as Alternative Investments: Empirical Analysis of Investment Performance, Market Independence, and Diversification Potential

9
Asset Classes
10
Years Analysis
120+
Pages Research

Key Findings

  • Comprehensive correlation analysis testing H1 & H3 hypotheses
  • Linear regression analysis for H2 & H4 market relationships
  • Statistical significance testing with p-values and confidence intervals
  • Portfolio diversification benefits across collectible categories
  • Digital asset correlations and emerging market dynamics

Institution: Solvay Brussels School of Economics and Management

Program: Specialized Master in Industrial and Technological Management

Format: PDF • 120+ pages • Academic Research

Back to Projects

For questions about this research or collaboration opportunities: