EQUI Employment
Law Firm
UI/UX Design & LinkedIn Performance Strategy for a boutique Brussels law firm.
2-month mission (August–September 2025) delivering LinkedIn growth strategy, Business Model Canvas workshops, interactive presentation design (HTML/CSS/JS), and digital presence optimization for EQUI’s employment law practice.
Data sourced from LinkedIn Analytics — Company Page dashboard, Aug–Sep 2025.
Mission Overview
My role: transforming EQUI’s digital presence through strategy, design, and development
Challenge
EQUI needed a strong LinkedIn presence to reach potential clients and compete in the Brussels legal market. Strategic guidance was required to refine their business model.
Solution
Designed user interfaces and optimized LinkedIn content strategy. Facilitated Business Model Canvas workshops to align digital strategy with business objectives.
Results
5,991 monthly impressions, 186% engagement growth, 65% impression increase, and strategic clarity through business model workshops during the 2-month engagement.
LinkedIn Performance
Measurable results from the LinkedIn Company Page — all data extracted from LinkedIn Analytics
Peak Monthly Performance
August 2025 marked the highest-performing month on EQUI’s LinkedIn page. These numbers come directly from the LinkedIn Analytics “Content” tab and reflect how many people saw, reacted to, and shared EQUI’s posts.
Source: LinkedIn Analytics — Content tab, August 2025
Growth Trajectory
Month-over-month growth rates comparing August vs. July 2025 on EQUI’s LinkedIn Analytics dashboard. Every metric improved after implementing the new content strategy and UI/UX recommendations.
Source: LinkedIn Analytics — month-over-month comparison, Jul vs. Aug 2025
Competitive Position
LinkedIn’s built-in “Competitor Analytics” feature lets you benchmark against similar companies. I tracked EQUI against other Brussels legal firms over the last 25 days of the mission.
Source: LinkedIn Analytics — Competitor tab, last 25 days of mission
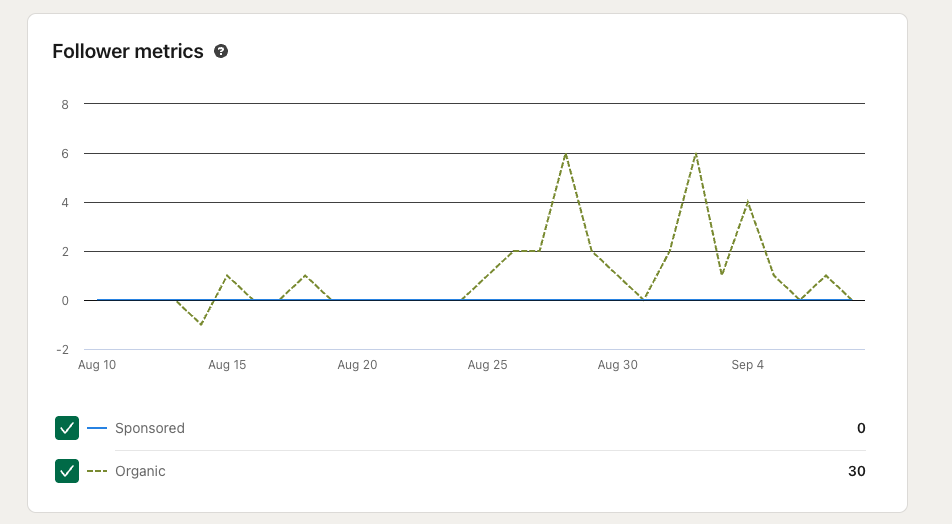
Follower Growth
All follower growth was 100% organic — no paid promotion or LinkedIn ads. Growth came from profile optimization, content strategy, and engagement tactics I designed and implemented.
Source: LinkedIn Analytics — Followers tab, Sep 2025
Business Model Canvas
Strategic facilitation aligning business objectives with digital strategy
Strategic Planning
Business Model Canvas workshops with EQUI’s leadership to identify value propositions, customer segments, and revenue streams.
Stakeholder Alignment
Cross-functional discussions ensuring all team members understood strategic direction and digital presence goals.
Strategy Integration
Connected business model insights to LinkedIn strategy and UI/UX decisions, supporting EQUI’s core objectives.
Key Outcomes
UI/UX Contributions
User-centered design approach for legal services digital presence
User Experience
- Content strategy optimization for LinkedIn audience engagement
- User journey mapping for professional service client acquisition
- Information architecture for legal service presentation
- Accessibility considerations for diverse professional audiences
- Mobile-first approach for LinkedIn content consumption
- Cross-platform consistency across digital touchpoints
Visual Design
- Professional brand identity implementation for LinkedIn
- Content visual hierarchy for maximum engagement
- Typography selection for legal industry credibility
- Color psychology application for trust-building
- Infographic design for complex legal concepts
- Visual storytelling for employment law expertise
Performance
- A/B testing methodologies for content performance
- Analytics interpretation and design iteration
- Conversion rate optimization for lead generation
- User behavior analysis and design improvements
- Performance metrics tracking and reporting
- ROI measurement for design decisions
Deliverables
Design achievements and business impact
UI/UX Design
- LinkedIn content strategy with user-centered design principles
- Visual hierarchy optimization for professional service marketing
- Mobile-responsive design approach for social media content
- Accessibility-compliant design for diverse audiences
- Brand consistency guidelines for digital touchpoints
- User journey mapping for client acquisition funnel
LinkedIn Performance
- 5,991 peak monthly impressions through strategic content design
- 186% engagement growth via optimized user experience
- 28 new organic followers during 2-month engagement
- 19.7% engagement rate (+87.6% vs competitors)
- #2 ranking in new followers within competitive legal market
- 100% organic growth strategy with no paid promotion
Strategic Facilitation
- Business Model Canvas workshop facilitation
- Stakeholder alignment sessions for digital strategy
- User research and persona development for target clients
- Content strategy framework based on business objectives
- Performance measurement and optimization protocols
- ROI tracking system for social media investments
Tools & Methodology
What I actually used during this mission
Design & Development
Analytics & Research
Strategy & Facilitation
Impact
Measurable results delivered