CellFlow
An innovative application for monitoring oxidative stress and cellular health
Creative Process
From "Regret" to "No Regrets"
My creative process began with a reflection on the concept of regret and its impact on our daily health. This exploration led me to develop a proactive solution for managing our well-being.
Concept Evolution
Pre-order Service for Takeout from Local Cafés and Restaurants
First iteration focused on daily stress prevention.
Integrated Solution for Seamless Ordering and Delivery
Integration of RFID sensors for quicker checkout .
Cellular Health Focus
Strong pivot towards a precise oxidative stress measurement.
Birth of CellFlow
CellFlow was born from the convergence of scientific research and technological innovation, offering a comprehensive solution for cellular health monitoring.
Precise monitoring of oxidative stress levels
Intelligent aggregation of biological data
AI-powered personalized recommendations
The e-Health Market
Understanding the e-Health Market
This section presents key metrics and trends in the global e-Health market, based on comprehensive research from leading healthcare organizations and market analysts. The data shown reflects:
- Market Growth: Projected expansion from 2023 to 2030, showing the increasing adoption of digital health solutions
- Innovation Drivers: Technology maturity and adoption rates across three key sectors
- Growth Factors: Key elements driving market expansion
Data sources include WHO reports, industry analyses, and healthcare technology surveys from 2023.
Market Growth
Annual Growth Rate
Compound Annual Growth Rate (CAGR)
15%
Innovation Drivers
Connected Devices
85%Key Insights:
- Wide adoption of wearable health devices
- Integration with electronic health records
- Strong presence in remote monitoring
Source: WHO Digital Health Report 2023
Telemedicine
75%Key Insights:
- Accelerated adoption post-COVID
- Ongoing reimbursement policy development
- Rural access challenges remain
Source: Global Telemedicine Market Analysis 2023
AI & Analytics
65%Key Insights:
- Growing adoption in diagnostic support
- Regulatory frameworks still evolving
- Data quality challenges persist
Source: Healthcare AI Implementation Survey 2023
Key Growth Factors
Aging global population driving demand
Remote management of chronic diseases
Integration of AI in healthcare solutions
Market Analysis Sources
The e-Health Landscape: Current Offerings
Wearable Devices
Wearable devices have revolutionized personal health monitoring. They track a variety of metrics, including heart rate, blood pressure, sleep patterns, and activity levels.
- Apple Watch
- Fitbit
- Garmin
Telehealth Platforms
Telehealth platforms enable remote consultations between patients and healthcare providers. They offer a convenient and accessible way to receive medical care.
- Doctor on Demand
- Teladoc
- Amwell
Health and Wellness Apps
Health and wellness apps provide tools for tracking diet, exercise, and mental health. They often offer personalized recommendations and support.
- MyFitnessPal
- Headspace
- Calm
At-Home Diagnostic Tests
At-home diagnostic tests offer convenient and accessible ways to monitor health conditions. They include:
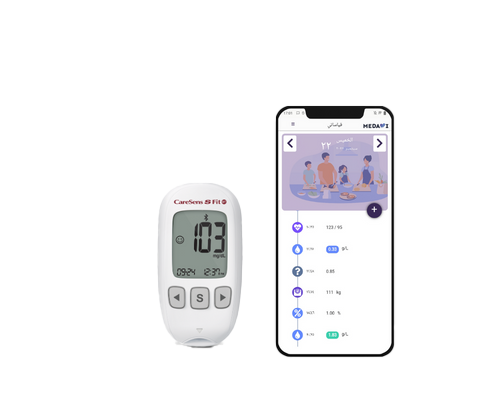
- Glucose Meters: For measuring blood glucose levels.
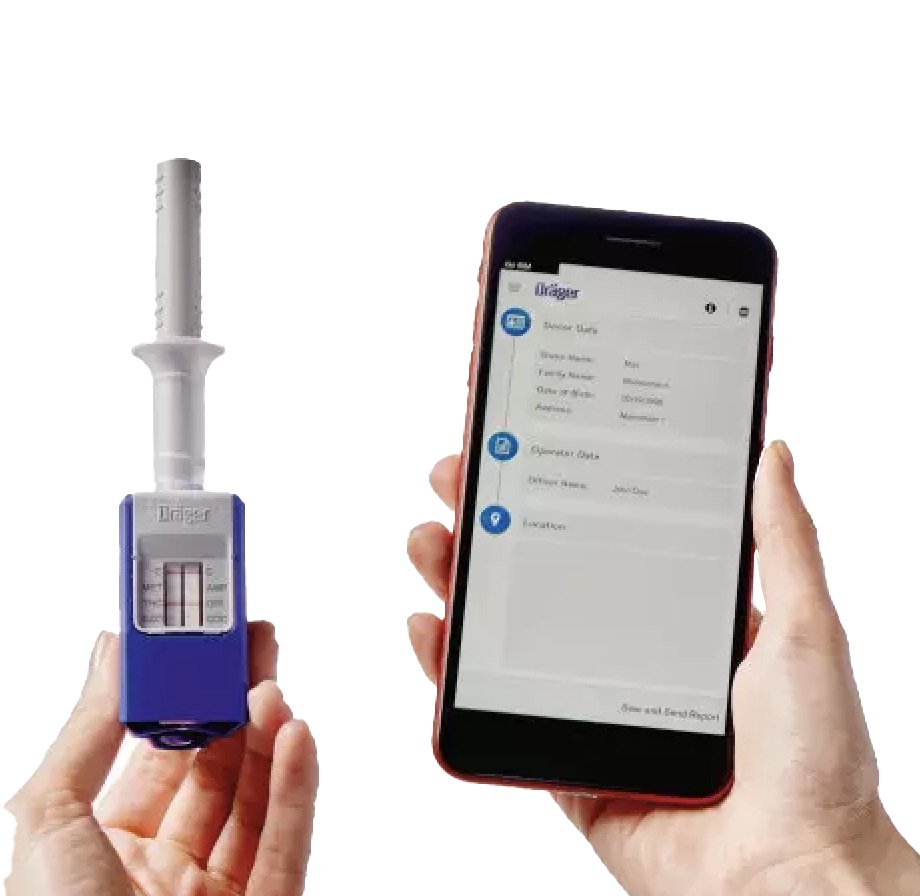
- Saliva Tests: Used for various purposes, such as hormone testing and DNA analysis.
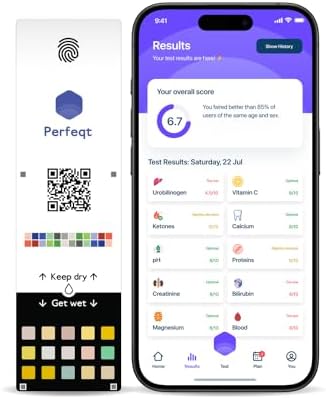
- Urine Tests: For detecting pregnancy, infections, and other health issues.
Many of these tests are now integrated with smartphone apps, allowing for easier result tracking and interpretation.
Glucose Meter
Saliva Test
Urine Test
Technical Analysis: what CellFlow can compile
Glucose
Measurement
Blood glucose concentration
Why
Excess glucose can lead to increased production of free radicals
Interpretation
Persistently high levels suggest an increased risk of oxidative stress
TAC
Measurement
Total antioxidant capacity
Why
A low antioxidant capacity indicates fewer resources to combat free radicals
Interpretation
A low result suggests depletion of antioxidant reserves, increasing vulnerability
Glutathione
Measurement
GSH/GSSG ratio - major antioxidant
Why
A low ratio indicates increased oxidative stress during free radical neutralization
Interpretation
A low ratio signals significant oxidative stress and high consumption of reserves
Additional Markers
Glutathione (GSH)
Measurement
Concentration of reduced glutathione (GSH) and oxidized glutathione (GSSG) in saliva
Why
The concentration of reduced glutathione (GSH) and oxidized glutathione (GSSG) can be analyzed in saliva
Interpretation
A decrease in GSH levels in saliva may suggest depletion of antioxidant defenses and high oxidative stress
Isoprostane F2
Measurement
Measurement of Isoprostane F2 (such as 8-iso-PGF2α)
Why
Isoprostanes are reliable indicators of lipid peroxidation
Interpretation
High levels of isoprostane in saliva indicate high oxidative stress
Carbonyl Protein
Measurement
Measurement of Carbonyl Protein in saliva
Why
Oxidized proteins are a direct marker of oxidative damage to proteins
Interpretation
High levels reflect a significant state of oxidative stress
Additional Markers
8-OHdG
Measurement
Biomarker of oxidative DNA damage
Why
High levels of 8-OHdG in urine are often associated with elevated oxidative stress
Interpretation
High levels of 8-OHdG in urine indicate significant oxidative damage to DNA in the body
F2-isoprostanes
Measurement
Products of lipid peroxidation
Why
F2-isoprostanes levels increase when cell membrane lipids undergo oxidative damage due to ROS
Interpretation
High levels of F2-isoprostanes in urine suggest increased lipid peroxidation, indicating significant oxidative stress
Malondialdehyde (MDA)
Measurement
Product of lipid peroxidation
Why
High MDA levels reflect damage to membrane lipids caused by free radicals
Interpretation
High levels of MDA in urine indicate increased lipid degradation
Additional Markers
User Journey
Experience a seamless flow from test initialization to personalized health insights

Connect/Register
The home screen for login or registration, offering quick access to the app's core functionalities.
A simple, intuitive interface to guide users toward connecting or registering effortlessly.
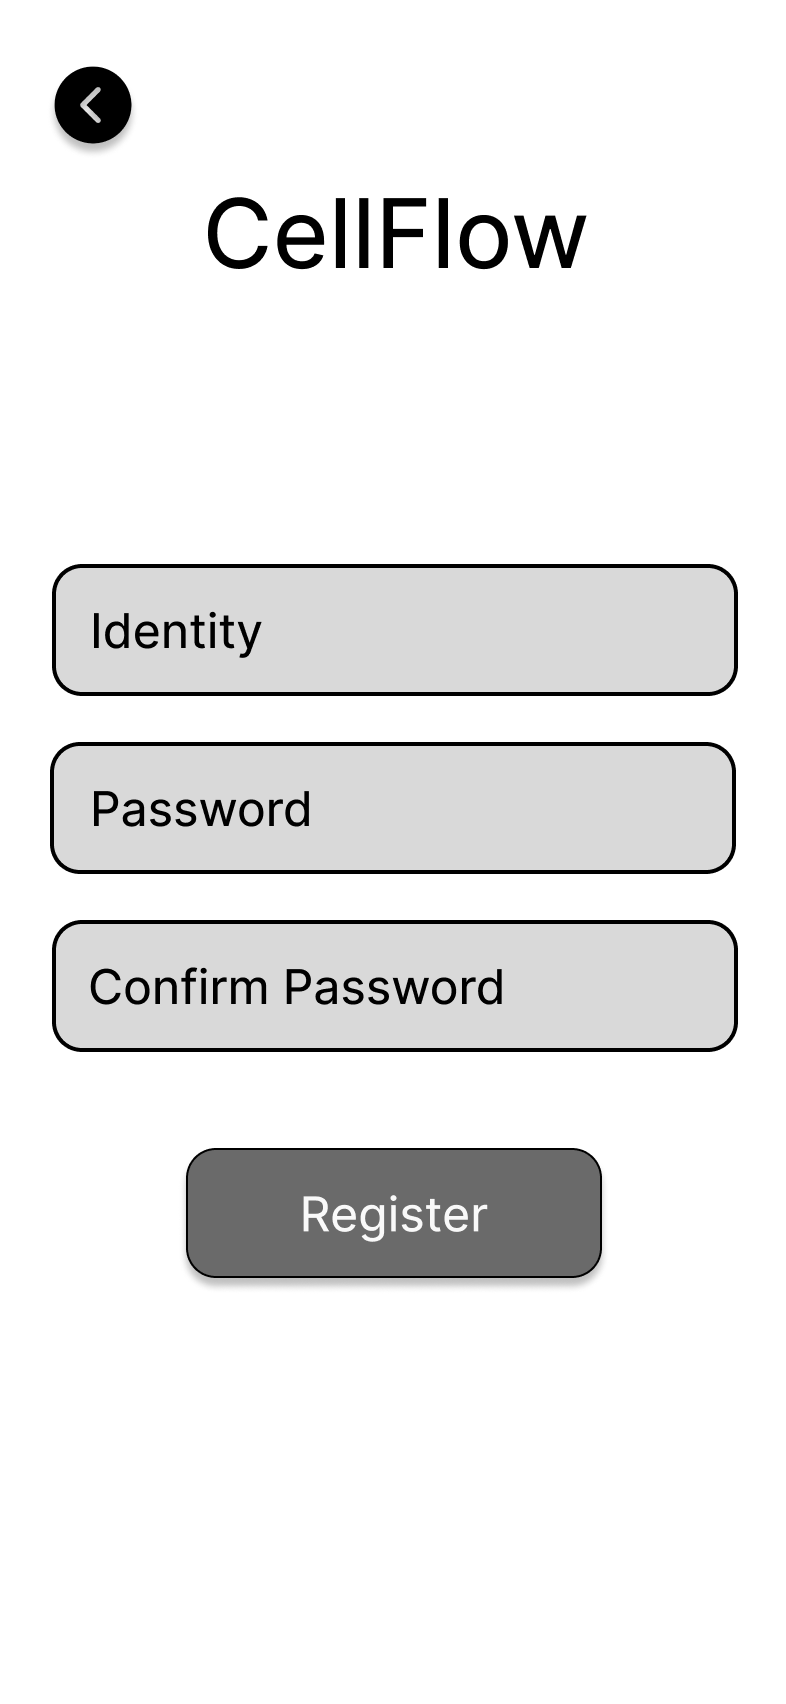
Register
User registration with fields for identity, password creation, and confirmation.
An easy-to-follow registration form designed for security and simplicity.
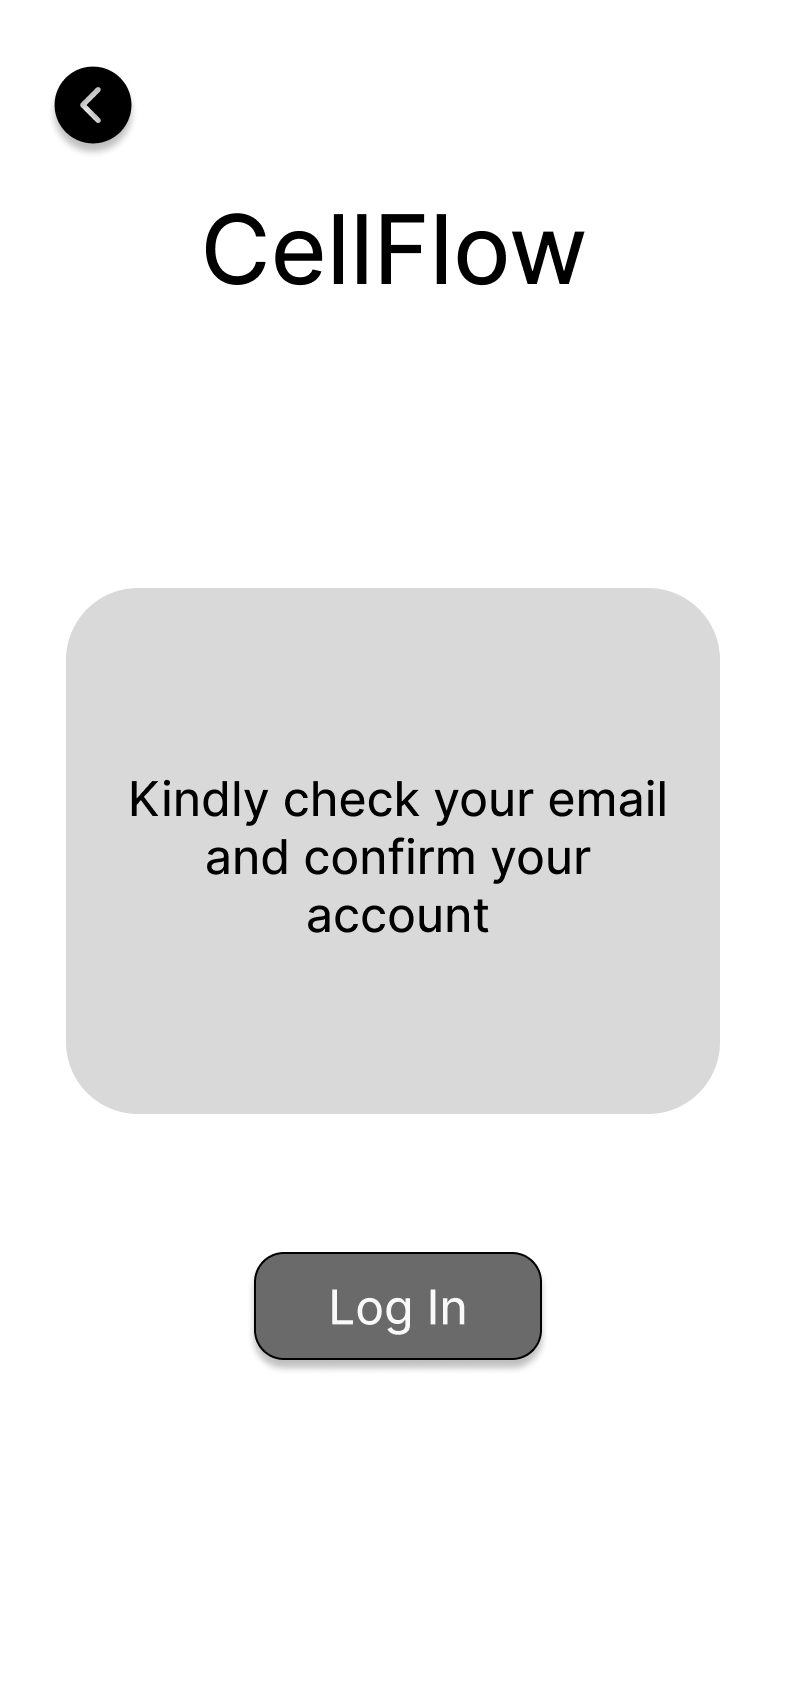
Check Your Email
Confirmation sent to the user's email address to verify their account.
A secure step to ensure users validate their identity before accessing the app.
Connect/Register
Login or register to access the application, ensuring a smooth onboarding process.
The gateway to the app, offering clear navigation for both new and returning users.
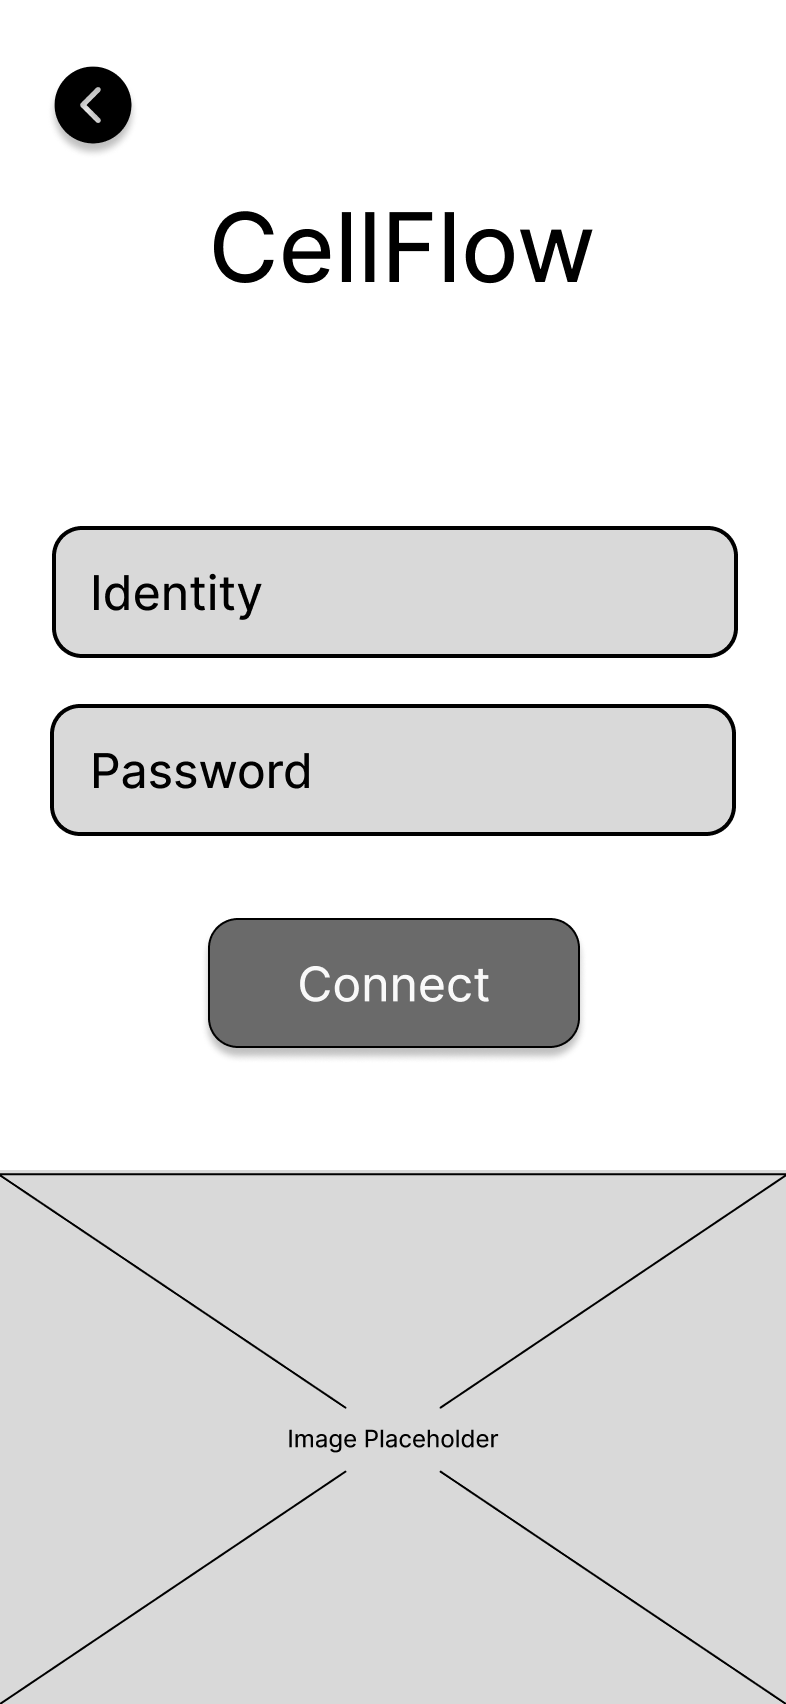
Identity & Password
Secure login and registration screen featuring identity input and password creation.
Ensures user privacy and data protection with intuitive password setup.

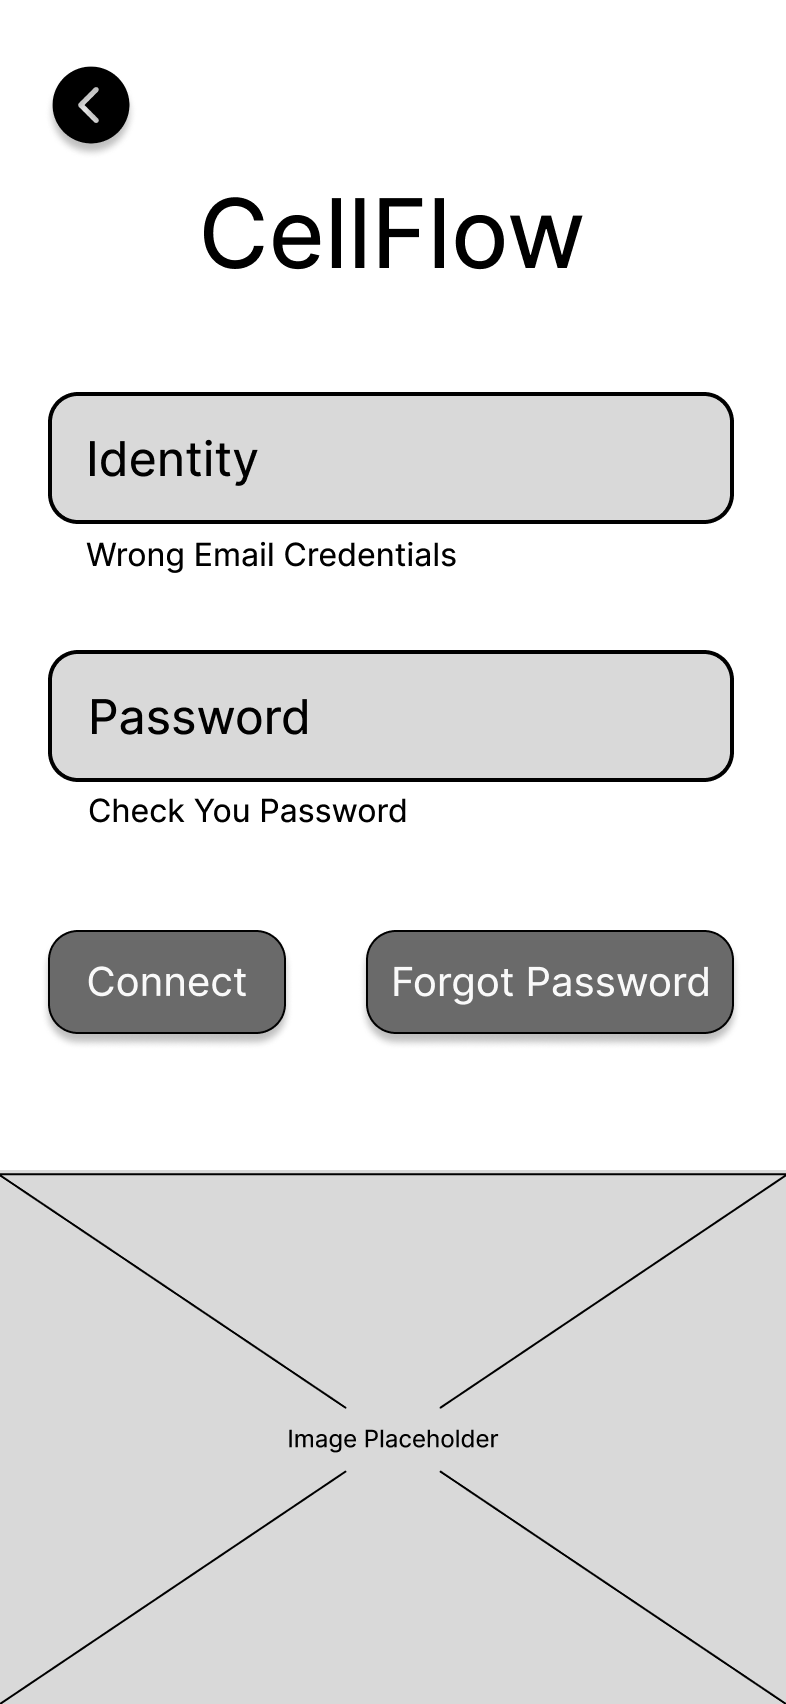
Forgot Password
Password recovery process for users who fail to log in.
A simple recovery flow to help users regain access securely and efficiently.
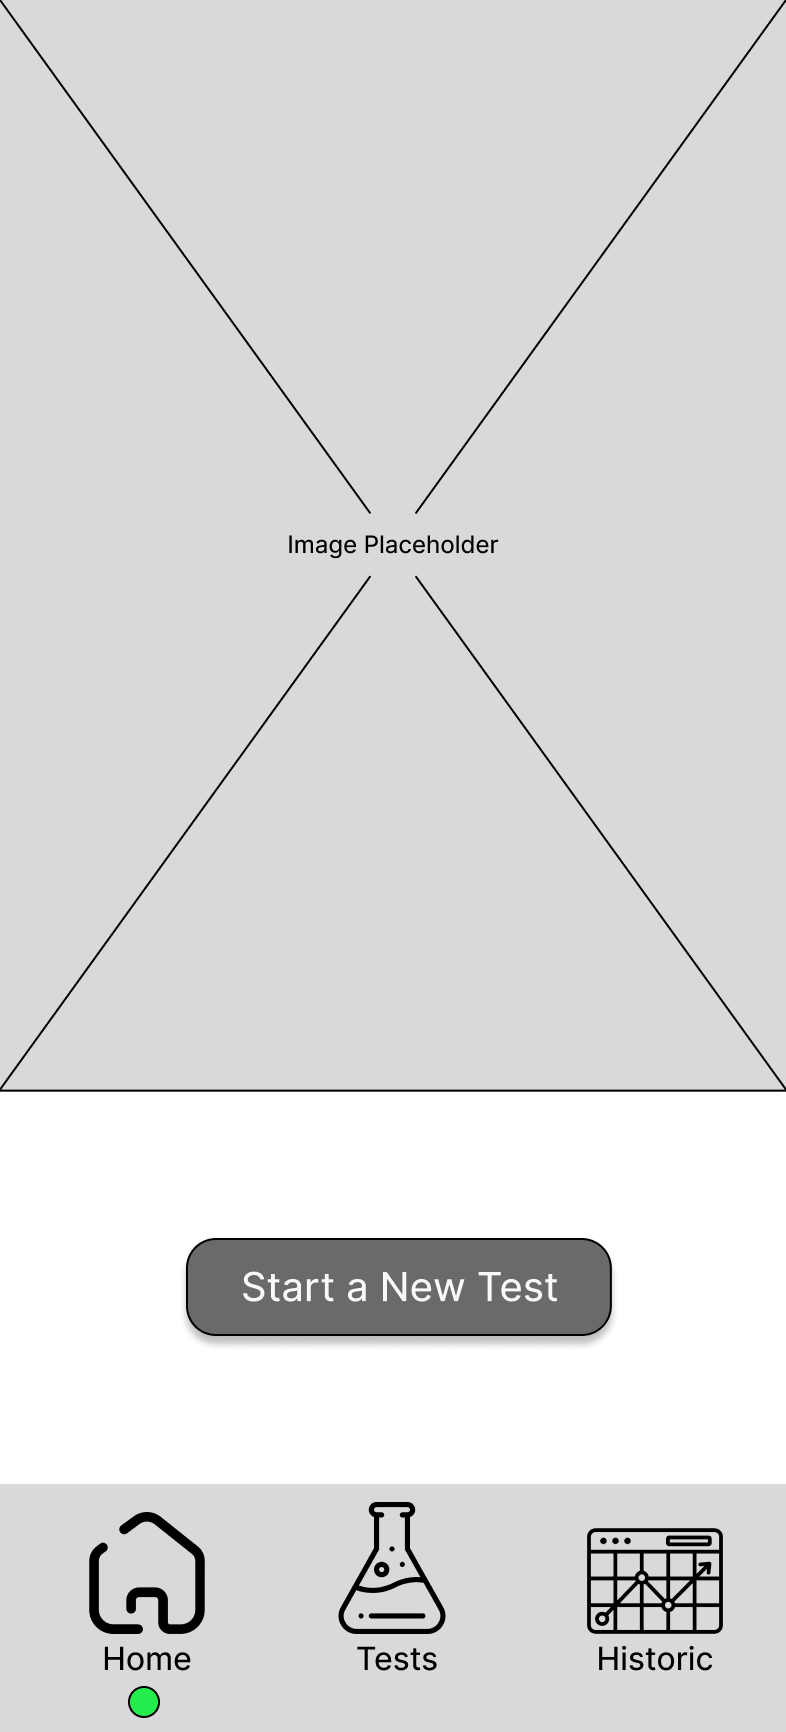
Start a New Test / Test History
Quickly start a new test or review past results through a user-friendly interface.
Enables users to manage their tests seamlessly, promoting easy tracking and new actions.
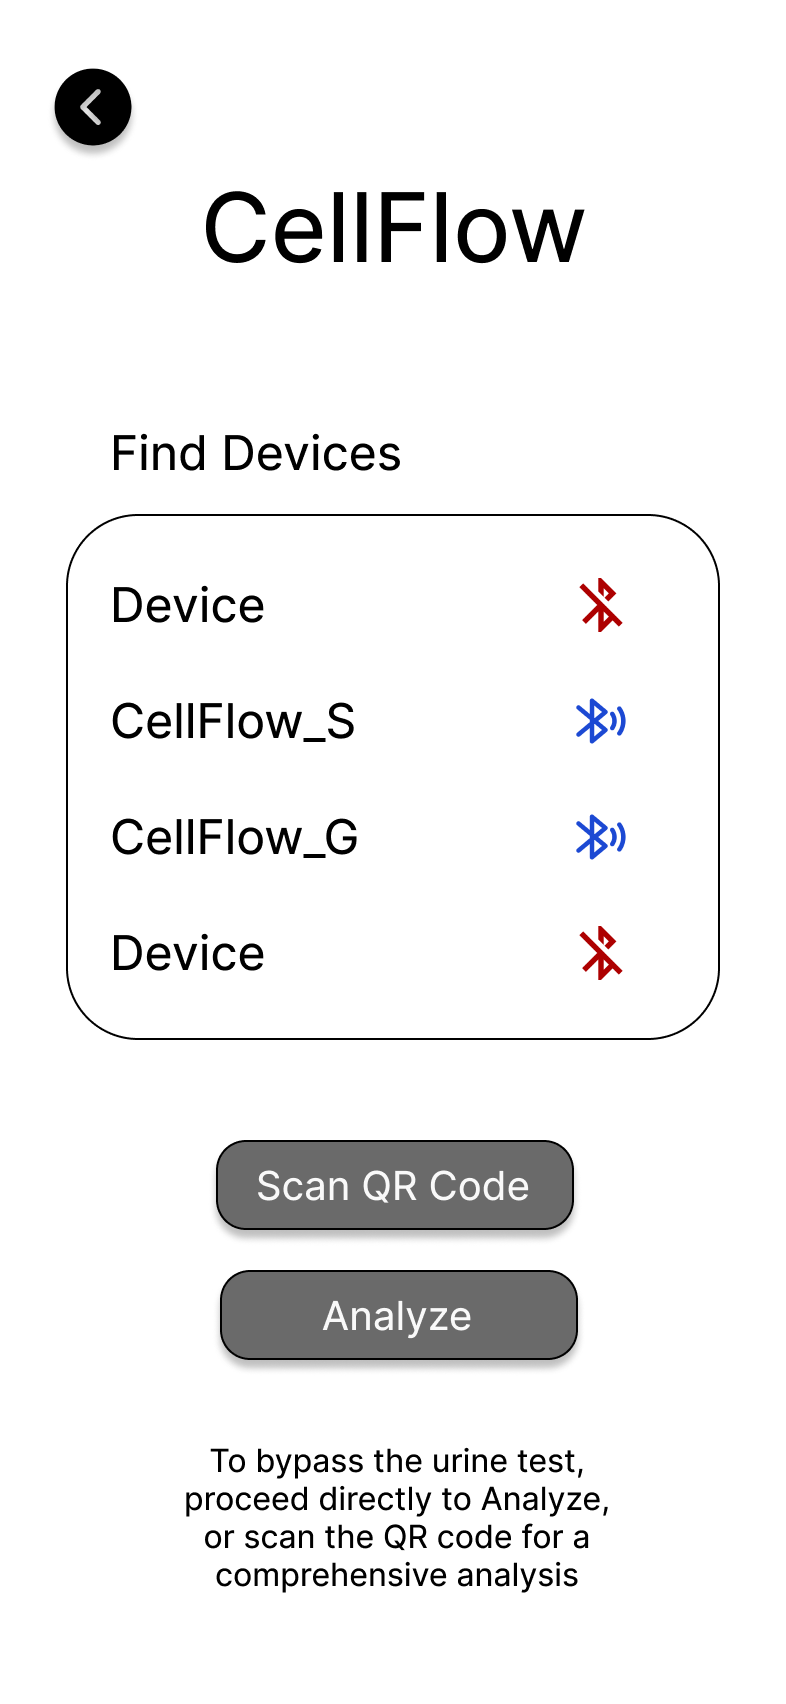
Find Devices & Choose Action
Locate devices via Bluetooth and select between analyzing data or scanning a QR code.
Effortlessly connect to devices and choose to analyze or scan data.
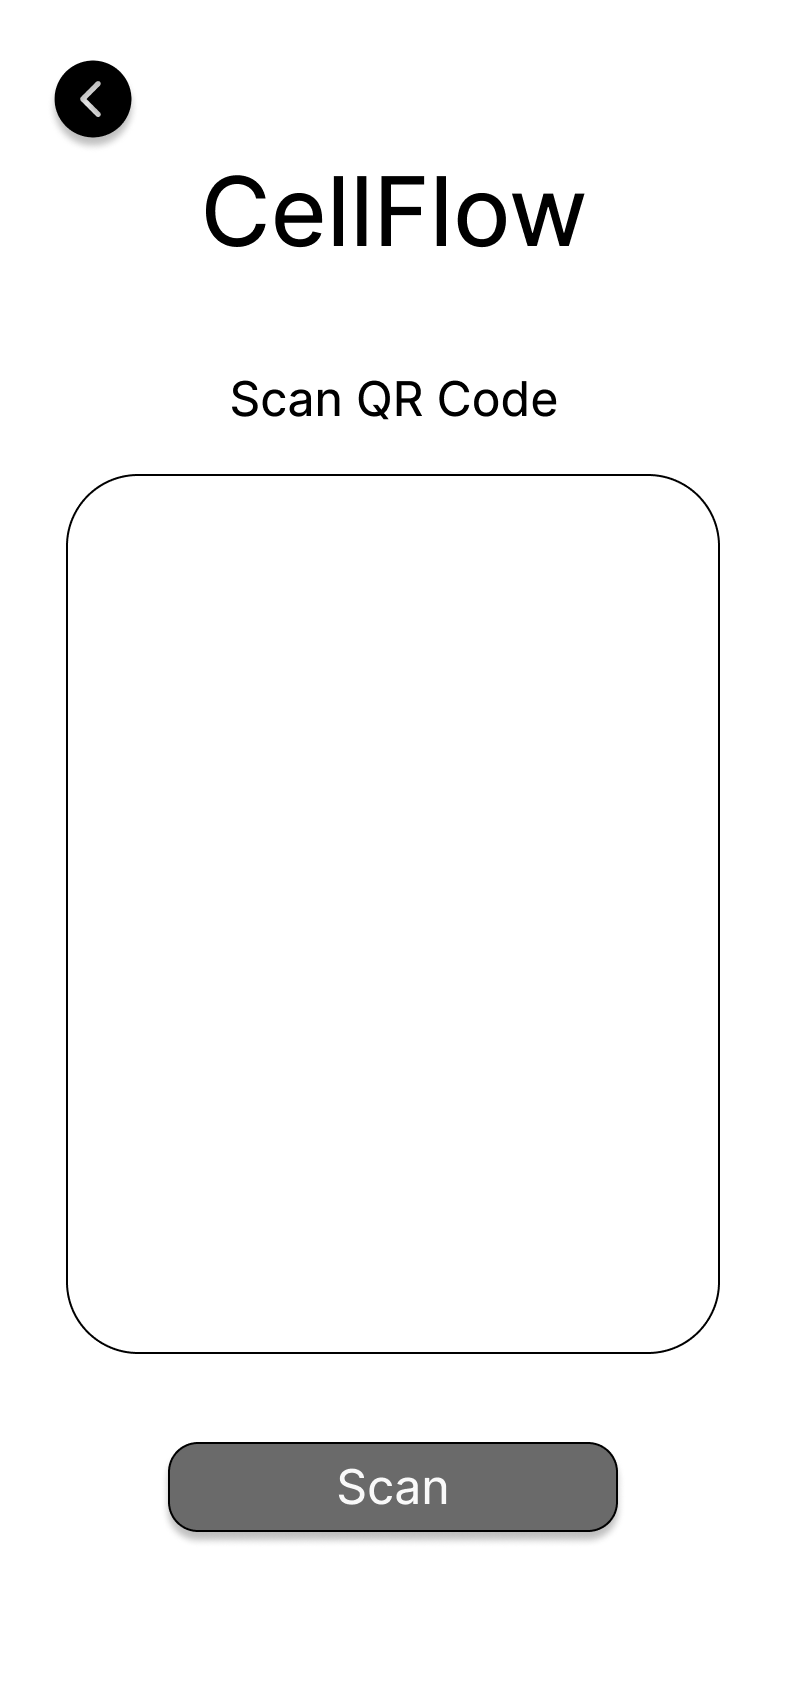
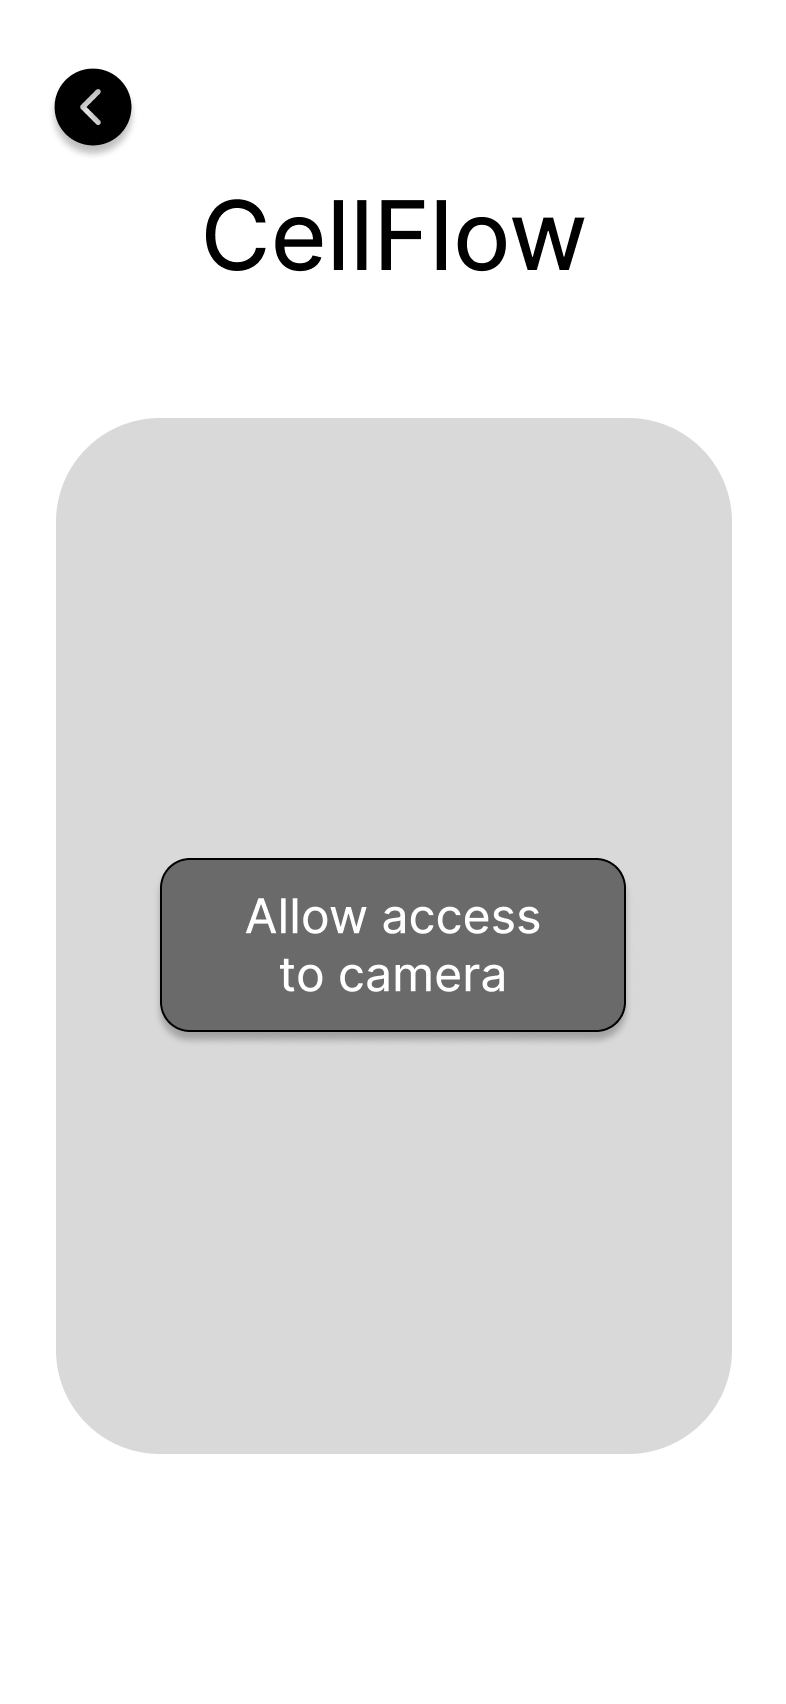
Scan QR Code
Use the app to scan QR codes for data retrieval or device pairing.
Seamless QR code scanning ensures quick and accurate data processing or pairing.
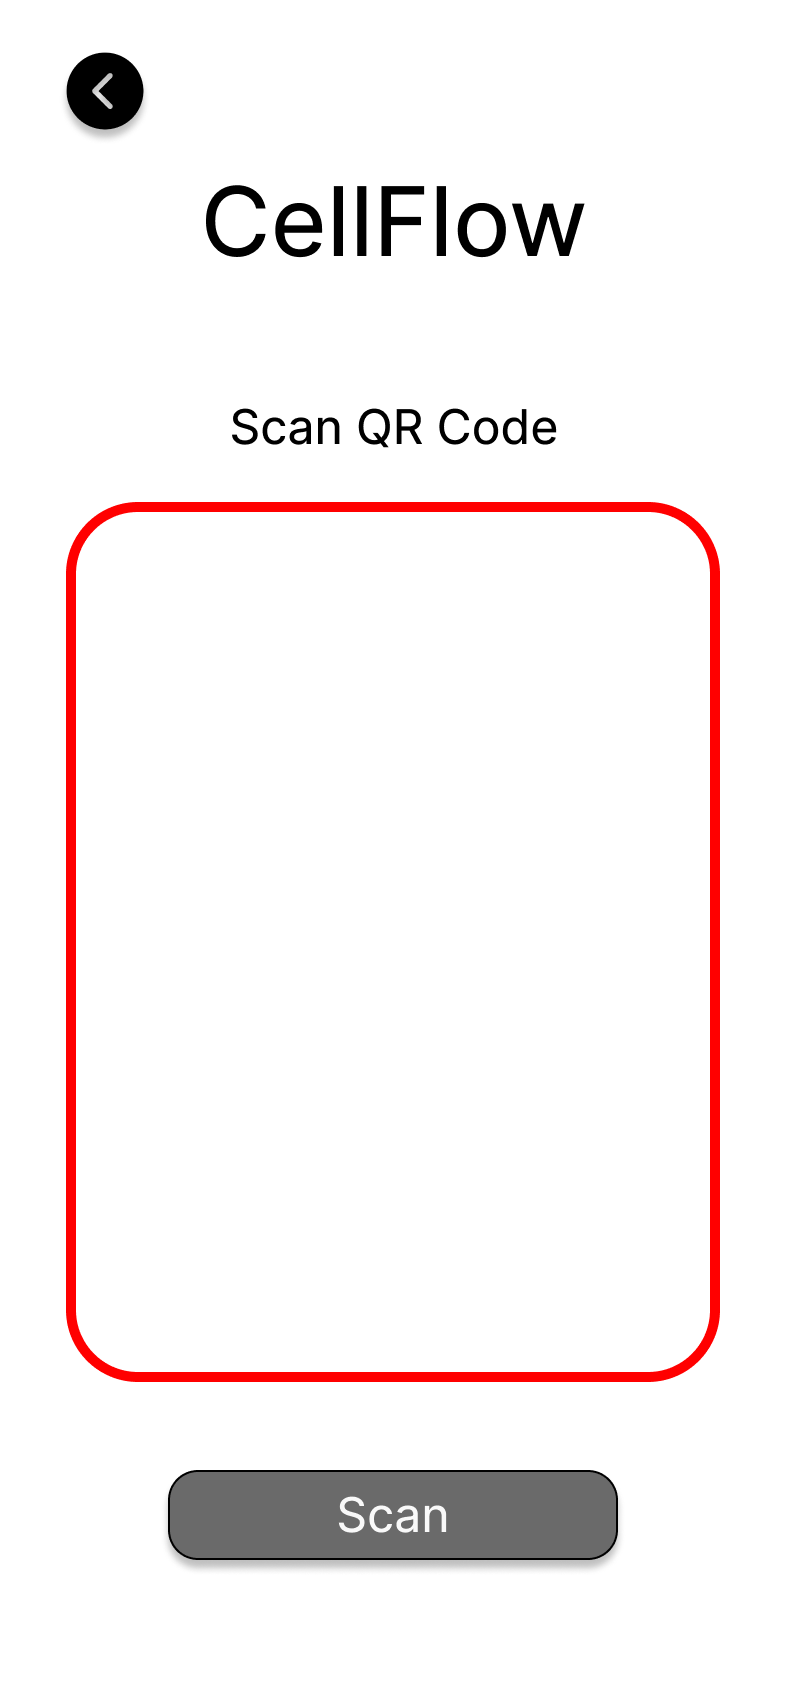
Scan Failed
The QR code scan was unsuccessful. Please try again.
Notifies users of a failed scan, prompting a retry for accuracy.
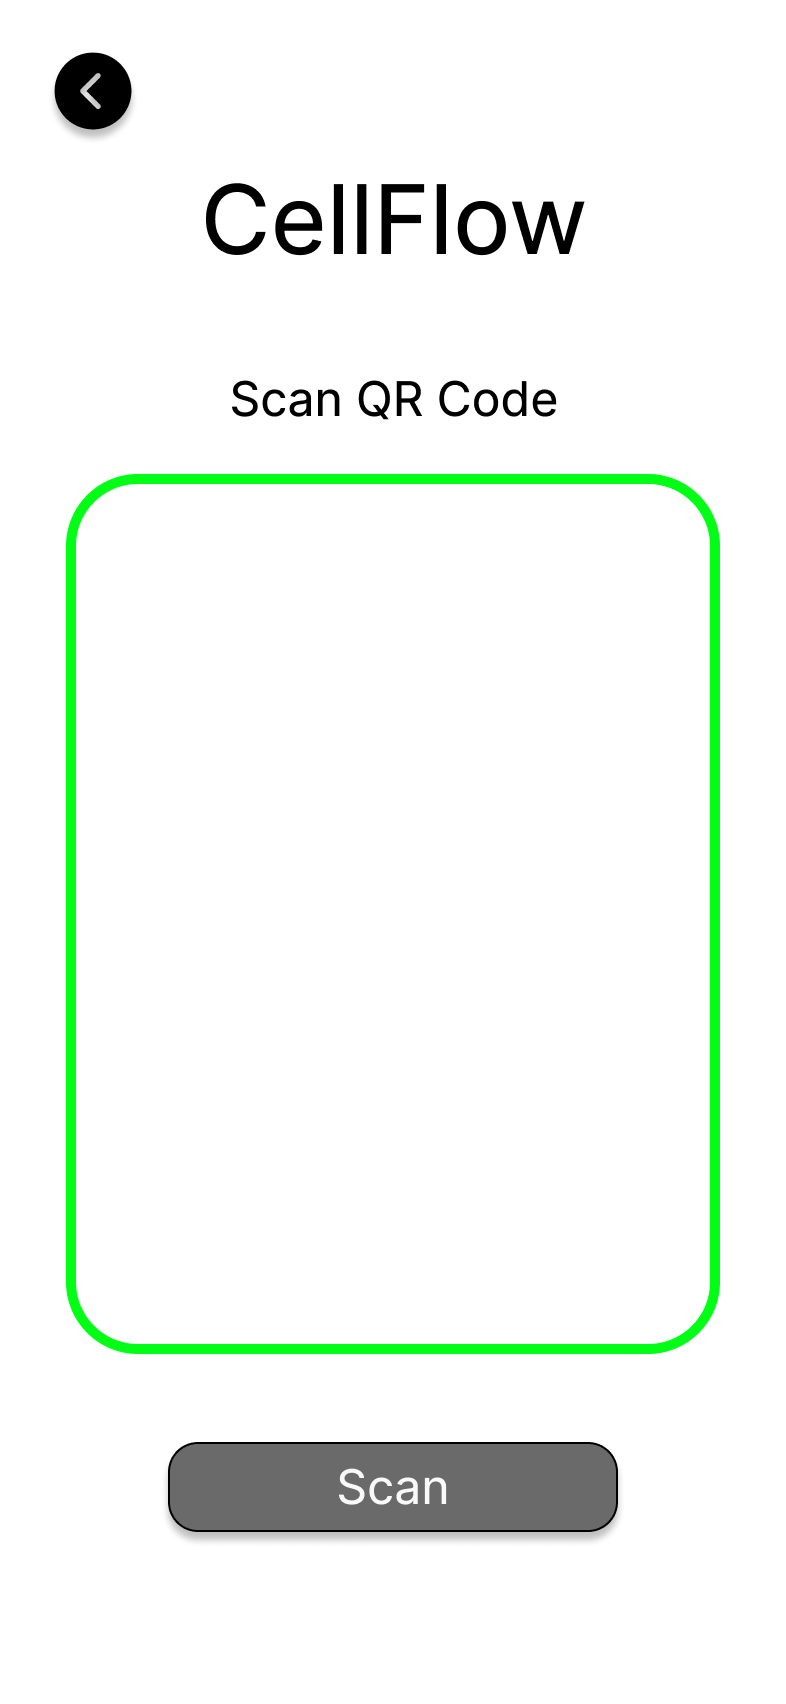
Scan Successful
QR code scan was successful. The relevant data is now being processed.
A confirmation that the scan was successful and data processing will follow shortly.
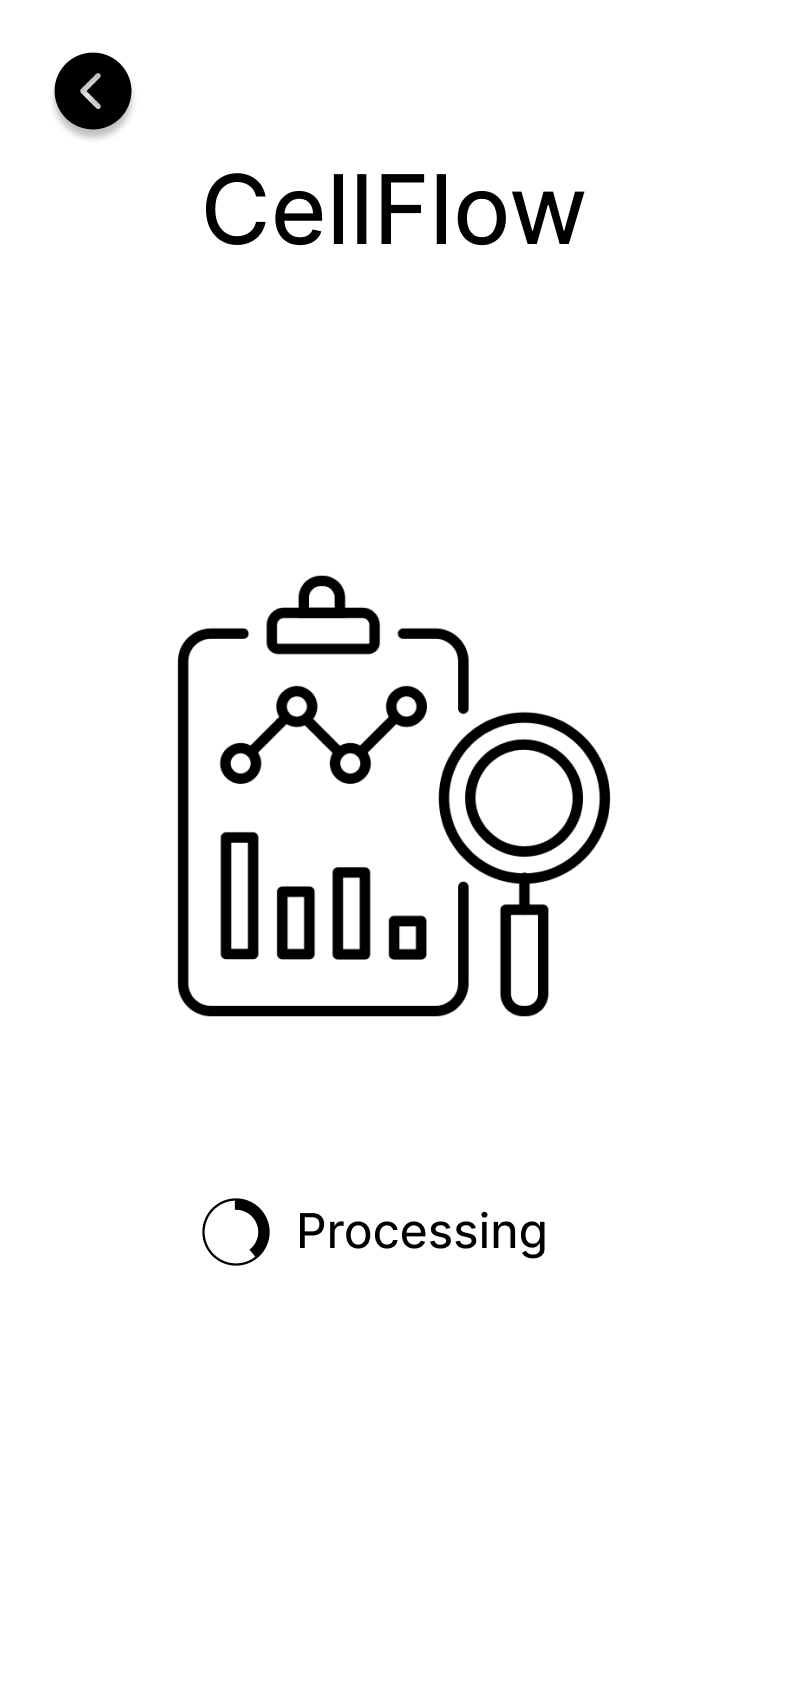
Processing Results
The system processes data from the QR code scan, glucometer, and saliva test for accurate results.
Combines test results for accurate and insightful analysis.
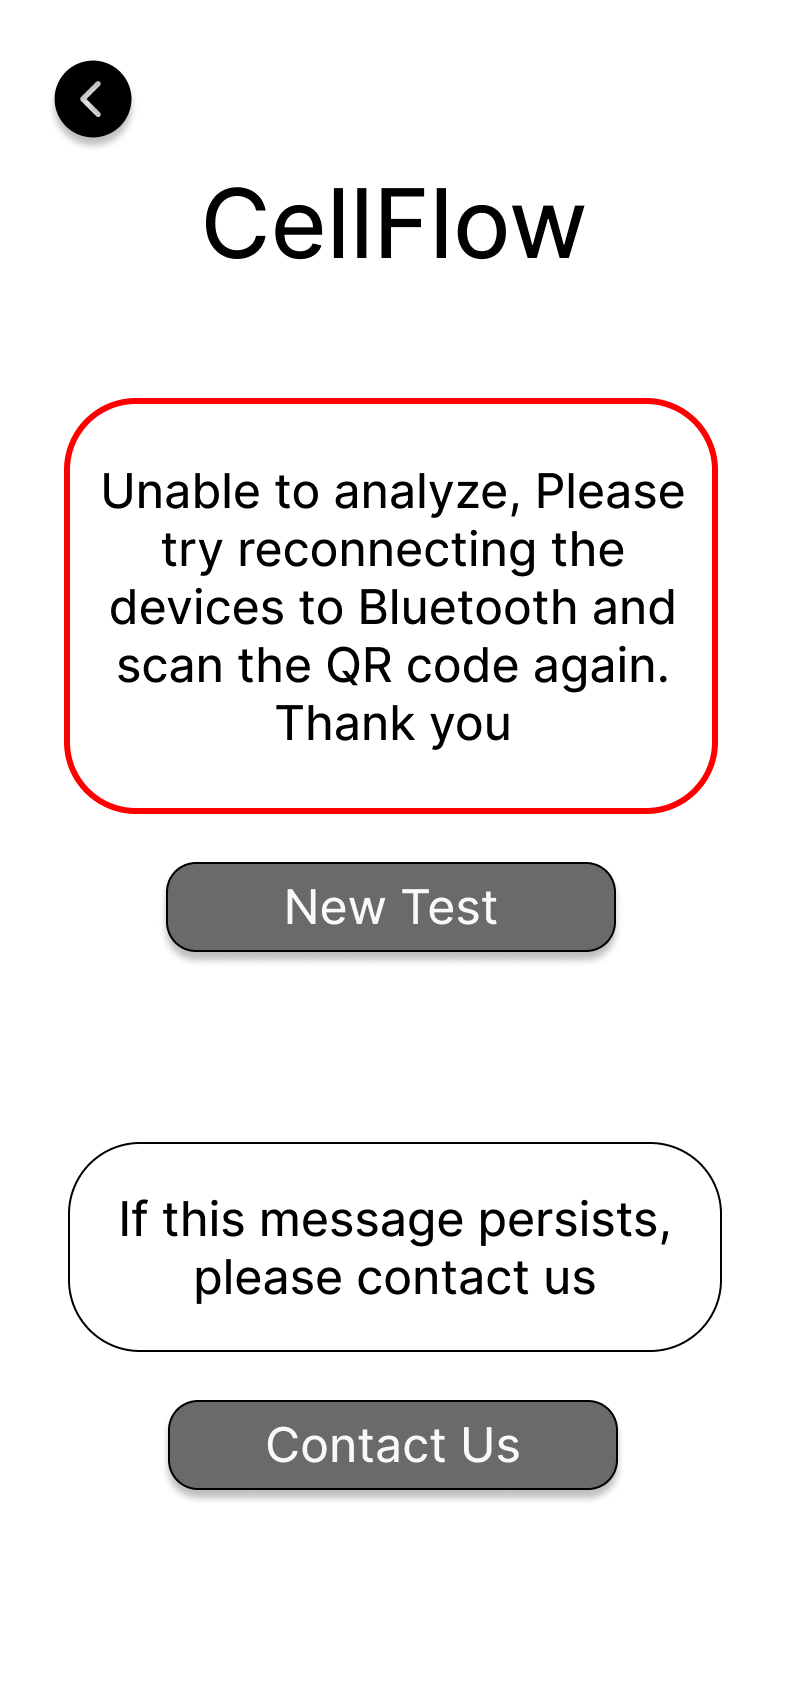
Bluetooth Pairing Issues
If there are issues pairing Bluetooth devices, please follow the instructions to reconnect.
Guides users to resolve pairing issues or contact support if needed.
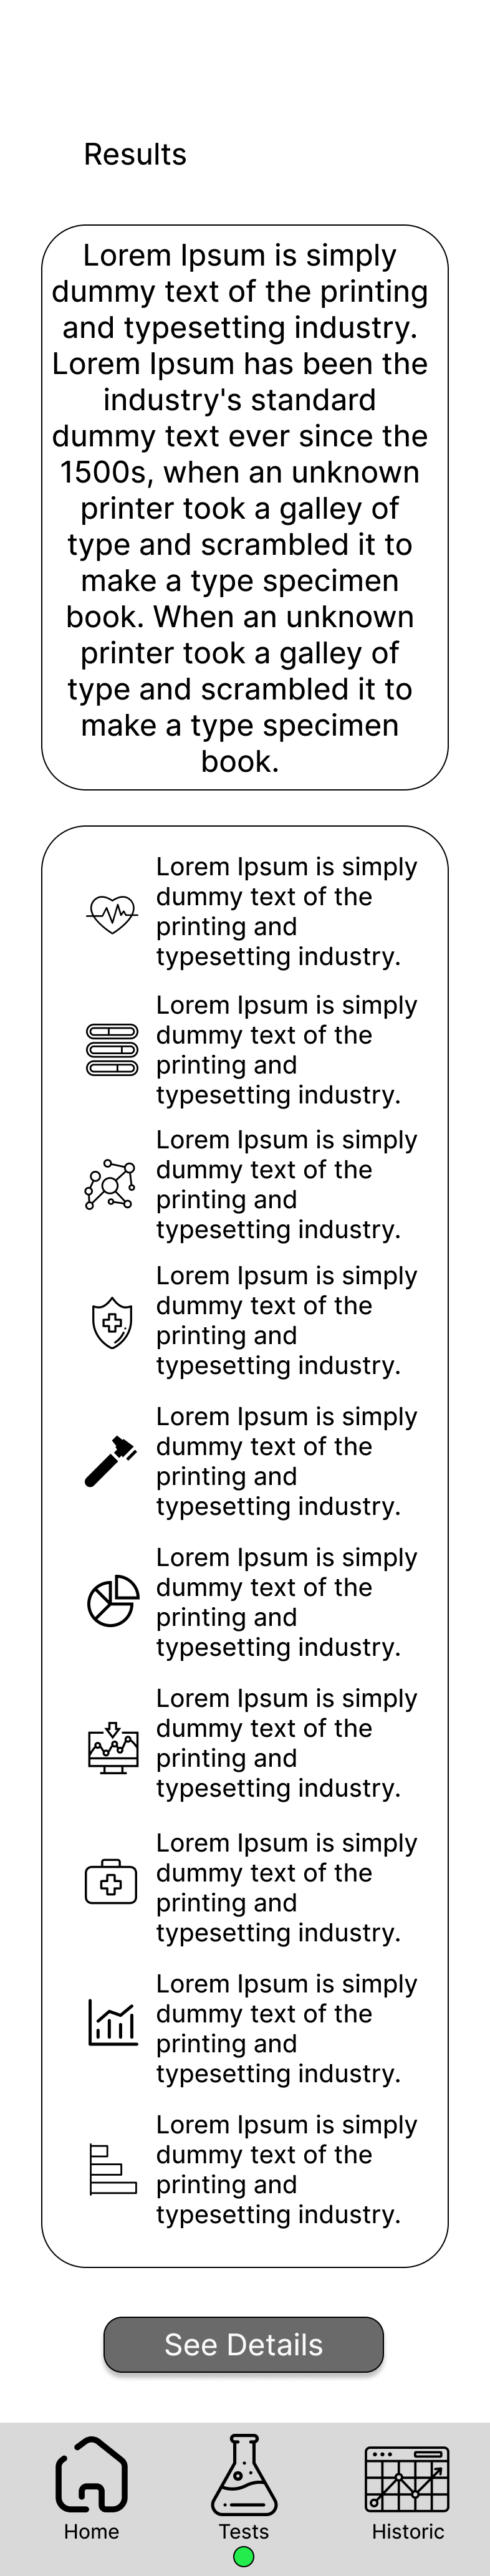
Results
View your test results with the option to see detailed analysis for better insights.
Results are shown clearly, with an option for detailed analysis.
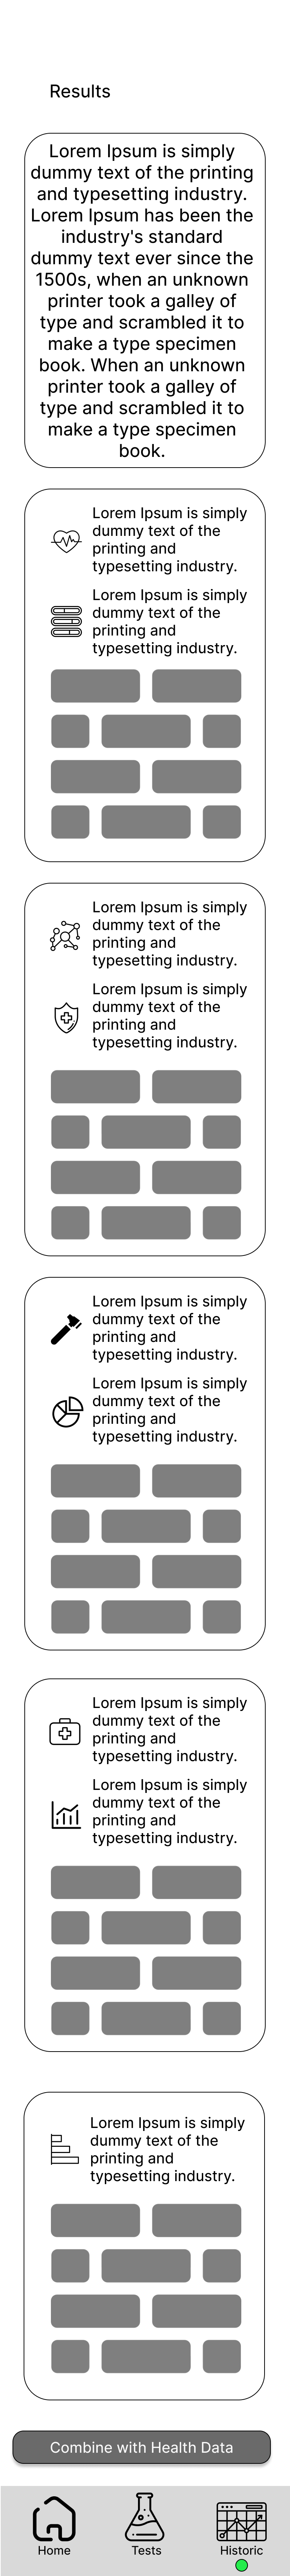
Analysis Details
View detailed analysis of your test results and choose to combine them with your health data.
Dive deeper into results and integrate them for a full overview.
Start New Test
Begin a new test session with our step-by-step guided process.
Simple and intuitive way to start your next health assessment.
Interested in collaboration?
I'm always open to discussing new projects and creative ideas.